How to Reduce Technical Debt Impact on Engineering Productivity
June 22, 2026
Reza Vatani
13 min read

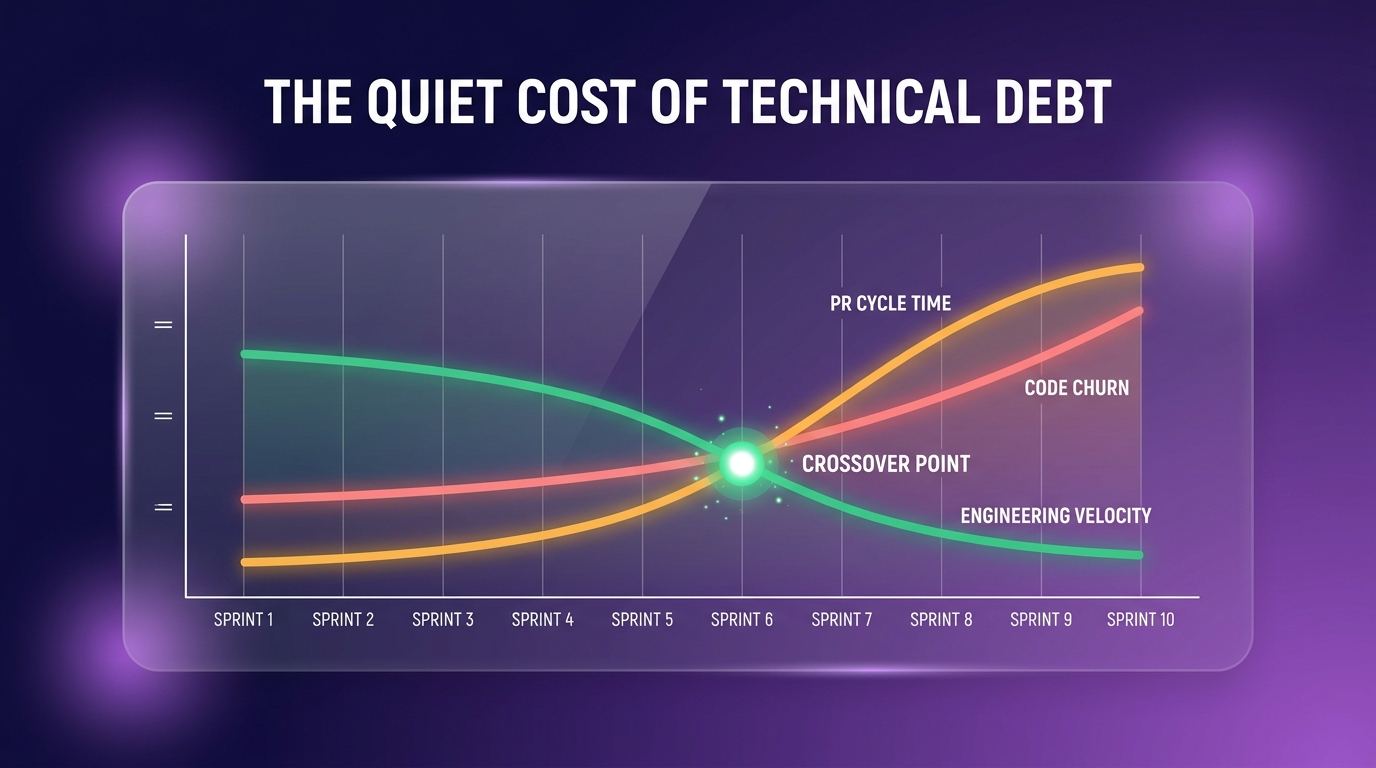
Technical debt drains engineering teams quietly. Pull requests slow down, reviews pile up, and velocity drops without anyone able to say exactly why. Most engineering leaders know the debt is there. What they lack is the data to measure its real cost or decide which parts to pay down first.
You can now quantify that cost with privacy-first workforce intelligence. By connecting GitHub, Jira, and HRIS data, you see where code complexity slows teams, which repositories create the most friction, and how much time goes to rework instead of new features. This guide covers how to measure, prioritize, and reduce technical debt using real productivity signals, not surveillance.
Key Takeaways
Q: How does technical debt actually hurt productivity?
A: It shows up as slower PR cycles, more code churn, more context switching, declining merge rates, and rising rework. Engineers spend more time understanding and re-fixing code than building features, and morale drops as every task takes longer than it should.
Q: How do you measure it without surveillance?
A: Read aggregated workflow signals from GitHub, Jira, and HRIS, never screenshots or keystrokes. PR cycle time, churn, merge frequency, and rework hours reveal which repositories and modules carry the heaviest debt.
Q: How do you prioritize what to fix?
A: Target high-impact, low-effort cleanup in code many engineers touch frequently, dedicate 15 to 20 percent of sprint capacity to debt, and schedule it every sprint rather than in crisis-driven batches.
Q: How do you prove it was worth it?
A: Track PR cycle time, churn, velocity, and DORA metrics before and after. Most teams see 20 to 40 percent productivity gains in refactored codebases within two quarters.
What is technical debt and why does it slow engineering teams?
Technical debt builds up when teams take shortcuts to ship faster. Old code stays in place, refactoring gets postponed, and quick fixes layer on top of each other. Over time that friction works its way into every part of development.
It shows up as slower pull request cycles, longer code reviews, and rising code churn. Engineers spend more time understanding existing code than writing new features. When someone touches a messy area, they need extra time to figure out how it works, test changes carefully, and clean up the bugs that surface.
The hidden costs go past raw time. Engineers get frustrated working in tangled codebases. They context switch more when navigating poorly documented systems. Morale drops when every task takes longer than it should. Capacity gets spent on rework instead of new capabilities, and new hires take longer to onboard because the code is hard to follow.
You cannot see technical debt by staring at the codebase alone. You have to track how it affects daily work patterns, review cycles, and velocity across teams.
How technical debt creates measurable productivity signals
Technical debt leaves clear fingerprints in your workflow. You spot it by watching how teams work, not just by reading code.
Rising PR cycle times signal growing complexity. When merging a change takes days instead of hours, the codebase has become harder to reason about, and reviewers need extra time to verify nothing breaks. Reducing code review cycle time gets harder as debt accumulates.
Increased code churn points to unstable code. When engineers repeatedly rewrite the same area or take several attempts to fix an issue, the architecture needs attention. High churn means the team does not fully understand how the code behaves.
Context switching spikes reveal navigation problems in legacy systems. Engineers jump between tasks more when they hit roadblocks, ask teammates for help, or pause to trace dependencies. Reducing context switching means fixing the root cause, not just protecting focus.
Declining merge rates and more rework rounds show mounting debt. Fewer PRs merged per week, or multiple review cycles per PR, both mean friction has gone up and teams are fixing more than they ship. Burnout risk follows when engineers spend too long in problematic modules, so tracking time in high-debt areas helps you catch it early.
| Signal | What it indicates | Healthy direction |
|---|---|---|
| PR cycle time | Code complexity and review friction | Flat or falling |
| Code churn rate | Codebase instability and rework | Below ~15% |
| Context switches per day | Navigation problems in legacy code | Low and steady |
| Merge frequency | Throughput vs friction | Stable or rising |
| Rework vs feature hours | Capacity lost to debt | Majority on features |
How to connect GitHub, Jira, and HRIS data to measure technical debt impact
You need connected data from several systems to see technical debt clearly. Abloomify pulls from your development tools without invasive monitoring.
The GitHub integration surfaces patterns in PR metadata, review times, and merge frequency. You see which repositories have the longest cycles, the highest churn, and the most rework, drawn from commit history, review comments, and merge patterns.
The Jira integration correlates issue types with time spent. You track how many hours go to bugs versus features, spot repeated issues in specific modules, and find epics that involve more refactoring than planned. That shows where debt quietly generates extra work.
HRIS data adds team context. You see which engineers work in high-debt areas, how debt lands on different seniority levels, and whether certain teams carry more of the burden. That helps you distribute refactoring fairly and spot skill gaps.
Throughout, Abloomify stays privacy-first: aggregated metrics only, never screenshots or keystroke logs, with a PII-free architecture. Engineers keep their privacy while leaders get the visibility they need.
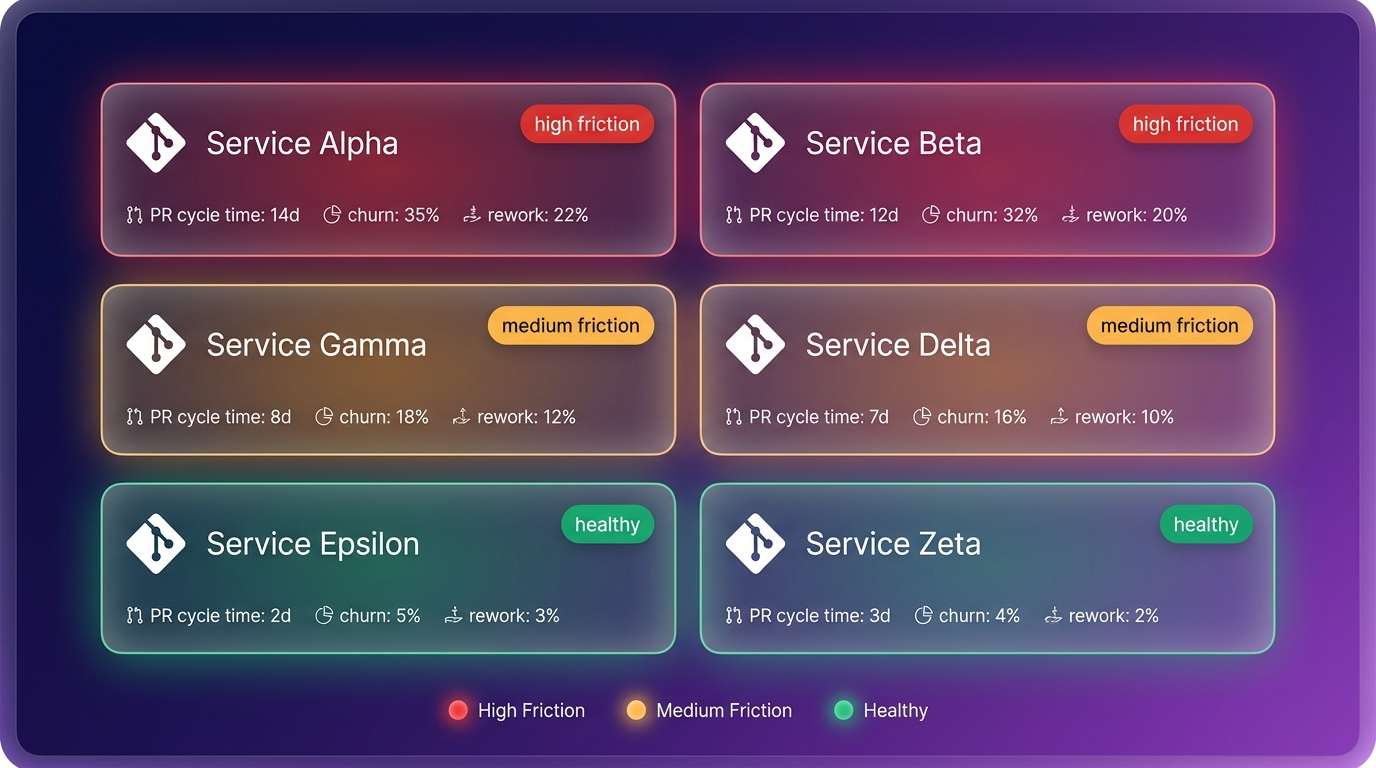
Combine these signals and you can pinpoint the repositories, modules, or services with the highest refactoring friction. The platform highlights where small changes need disproportionate effort, which codebases slow new feature work, and what the debt costs in real time.
Using Bloomy AI analyst to quantify technical debt costs
Most leaders do not have time to hunt through dashboards for debt patterns. Bloomy, the AI Chief of Staff, answers questions in plain language instead.
Ask "Which repositories have the longest PR cycle times?" or "Where is code churn highest this quarter?" and Bloomy searches across connected GitHub, Jira, and calendar data to answer. No manual report building.
It visualizes debt hotspots across teams, sprints, and codebases, so you see which services create the most friction, what share of engineering time goes to rework, and how debt levels shifted over time. Patterns that are easy to miss in raw data surface on their own.
You can also put a number on lost time. Ask "How many hours did the payments team spend on bug fixes versus new features last month?" and the answer comes back with specifics from your actual workflow data. That quantifies the cost in terms leadership understands, and Bloomy tracks the trend so you can see whether debt is growing, which interventions worked, and where new hotspots are forming.
How to prioritize technical debt reduction without disrupting delivery
Technical debt competes with feature work for limited capacity. You need a systematic way to fund both without killing momentum.
Start with capacity planning to see real available bandwidth. Work out how much time teams can realistically give to refactoring without missing deadlines. Most successful teams dedicate 15 to 20 percent of sprint capacity to debt.
Go after high-impact, low-effort opportunities first. Look for code that many engineers touch often, churns frequently, and could be simplified in a single sprint. Those deliver immediate gains without long projects.
Right-size sprint capacity using utilization and velocity data, and do not overcommit on debt sprints. Leave buffer, because refactoring often uncovers more issues, and track actual versus estimated effort to sharpen future planning.
Use DORA metrics to confirm improvement. Watch deployment frequency, lead time for changes, change failure rate, and time to restore service. Debt reduction should move these within one to two quarters. Schedule the work consistently rather than in big chunks, since small, regular refactoring keeps codebases healthy without dramatic slowdowns.
Tracking the ROI of technical debt paydown initiatives
Leadership needs proof that debt reduction pays off. Workforce intelligence gives you concrete before-and-after numbers.
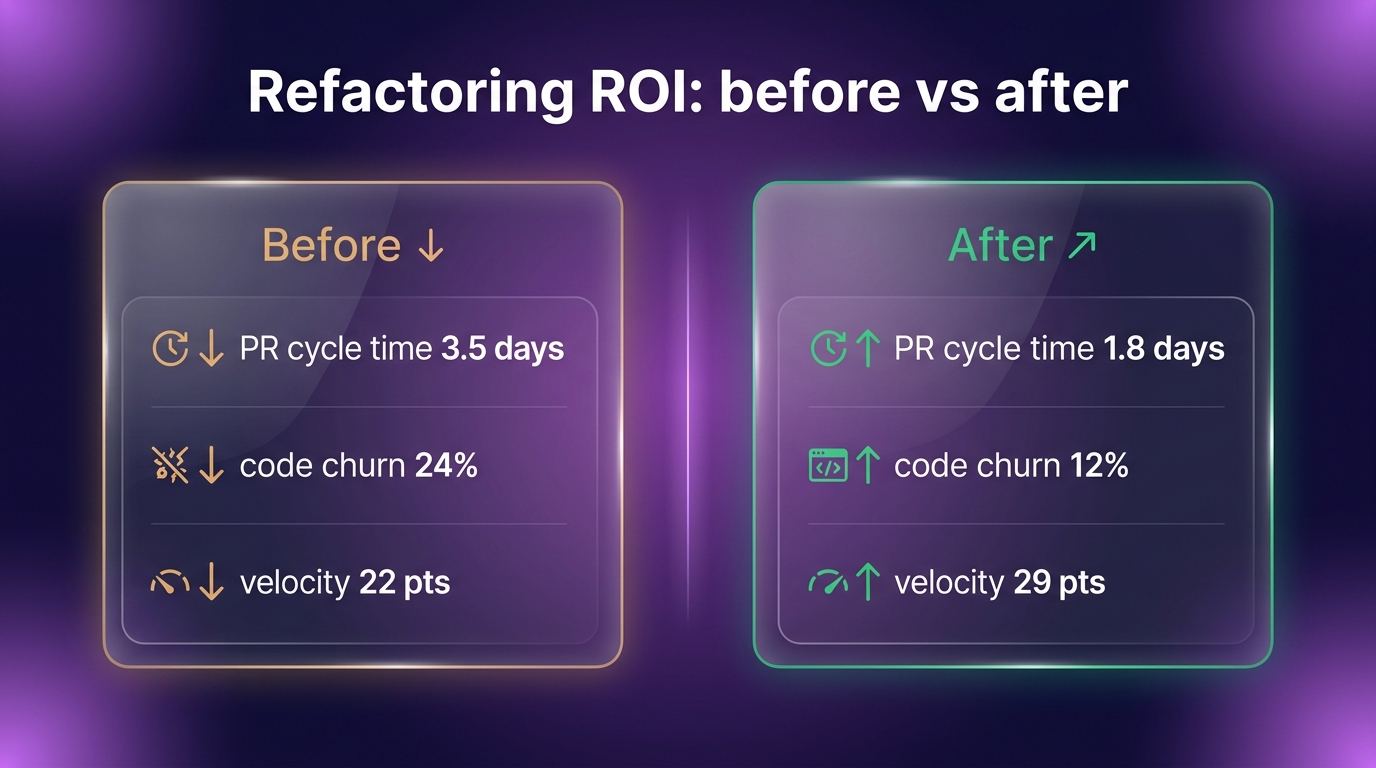
Measure PR cycle time after refactoring. Track average time from PR creation to merge in the affected repositories. Good refactoring cuts cycle times by 20 to 40 percent within two sprints, which directly speeds up feature delivery.
Watch churn and merge frequency. After cleaning up a module, expect fewer rewrites and more first-attempt merges. Multiply the churn reduction by average engineer cost to show dollars saved. Correlate the cleanup with engineering velocity too, since velocity typically rises 15 to 30 percent once teams escape a high-debt codebase.
Track developer experience and burnout-risk alongside the hard metrics. Survey engineers on code quality and satisfaction, and watch whether burnout-risk scores fall as people work in cleaner code.
How AI coding tools can accelerate or worsen technical debt
AI coding tools cut both ways. They help engineers write code faster, but they can also generate lower-quality output that becomes tomorrow's technical debt.
Agentic AI coding tools make rapid prototyping real. Engineers build features in hours instead of days with Cursor, GitHub Copilot, or Claude Code, which frees them to focus on architecture and cuts repetitive work. The risk is accepting AI-generated code without careful review. These tools sometimes produce code that runs but lacks proper error handling, tests, or documentation, or leans on outdated patterns and inconsistent style. That ships as debt.
Measure AI-generated code quality with review health and churn. Track how often AI code review catches issues, how much AI code gets rewritten, and whether AI-assisted PRs carry longer cycle times. High churn in AI-generated code is a quality warning.
Track tool ROI by weighing productivity gains against debt costs. Abloomify measures how Cursor versus Copilot affects your specific workflows, and the Cursor integration shows which engineers use AI effectively and which generate more rework. Set guardrails to keep AI debt from piling up: require human review for all AI code before merge, hold AI output to your code quality standards, define an AI usage policy that balances speed with maintainability, and train engineers to recognize weak suggestions.
Best practices for ongoing technical debt management using workforce intelligence
Technical debt management works best as a habit, not a one-time cleanup. Workforce intelligence makes continuous improvement sustainable.
Set debt KPIs your teams track regularly. PR cycle time, code churn percentage, and rework hours are the core three. Set targets like keeping average PR cycle time under 24 hours or churn below 15 percent, and review them weekly so problems surface fast.
Hold regular debt reviews using Abloomify dashboards and Bloomy insights. Meet monthly or quarterly to examine trends, mark improvements, and set the next priorities, and keep technical debt visible next to the feature roadmap in planning.
Create visibility for engineering leaders without surveillance. Share aggregated metrics that show team patterns, not individual performance, and connect them to delivery timelines and capacity planning. Give managers data-driven refactoring roadmaps through performance management tools that highlight debt in their areas so they can decide where cleanup pays off most.
Align debt reduction with OKRs and sprint goals. Track OKR progress that includes technical-health objectives, and make code quality an explicit goal rather than an afterthought. Build a culture where debt is discussed openly without blame, using the data to show it is a normal part of development and the focus is systematic improvement, not fault-finding.
FAQ
How can you measure technical debt without monitoring individual developers?
You measure it through aggregated workflow signals, not individual tracking. Privacy-first workforce intelligence analyzes patterns in PR cycle time, code churn, review health, and rework across teams. You see which repositories, modules, or services create friction without watching what any one engineer does. The data comes from GitHub, Jira, and other systems that already track work, never from screenshots or keystroke logging.
What workforce intelligence metrics indicate high technical debt impact?
Rising PR cycle times point to growing code complexity. High code churn signals unstable code that needs repeated changes. Declining merge rates indicate mounting friction in the development process. Increased context switching suggests engineers struggle to navigate legacy code. Growing rework and bug-fix time relative to feature work shows the cost, and burnout-risk signals in teams working on problematic modules indicate the debt has become unsustainable.
Can AI coding tools like Cursor and Copilot help reduce existing technical debt?
They can when used strategically. AI accelerates refactoring by generating boilerplate, suggesting cleaner patterns, and automating repetitive changes like updating deprecated APIs or standardizing style. The risk is that accepting low-quality suggestions without review creates new debt. The fix is measuring AI-generated code quality through review health and churn metrics, then adjusting usage policy based on results.
How do you balance feature delivery with technical debt paydown using capacity planning?
Allocate a consistent share of sprint capacity to debt, usually 15 to 20 percent. Use workforce intelligence to see how much time already goes to unplanned rework, then target high-impact, low-effort cleanup for quick wins. Schedule debt work every sprint rather than in large chunks, and track DORA metrics to prove the cleanup actually improves delivery speed over time.
What is the ROI of investing engineering time in technical debt reduction?
Faster PR cycle times ship features sooner. Lower code churn eliminates wasted hours on repeated changes. Higher velocity increases story points delivered per sprint. Lower burnout risk reduces expensive turnover, and better developer experience improves hiring and retention. Calculate ROI by measuring these before and after refactoring, then multiplying time saved by average engineer cost. Most teams see 20 to 40 percent productivity gains in refactored codebases within two quarters.
How does technical debt affect engineering velocity and DORA metrics?
It degrades all four DORA metrics. Lead time for changes rises because engineers need longer to understand and modify complex code. Change failure rate climbs as brittle systems break more often. Deployment frequency drops when teams hesitate to ship from messy codebases. Time to restore service extends because debugging is harder in poorly structured code. Technical debt also reduces velocity by forcing teams to spend capacity on rework and firefighting instead of new features.
Can Abloomify's AI agent (Bloomy) help prioritize which technical debt to tackle first?
Yes. Bloomy analyzes your connected GitHub, Jira, and HRIS data to recommend priorities. Ask questions like which repositories create the most rework or where refactoring would give the biggest velocity gain, and it identifies high-impact areas by looking at churn, PR cycle length, and engineer friction. It estimates time savings from different refactoring projects and suggests a prioritized roadmap based on your team's actual constraints and capacity.
Reza Vatani
Co-Founder & CAIO
AI-driven entrepreneur with a strong background in robotics and advanced analytics. PhD from Old Dominion University and former Product Development leader at Nasdaq Verafin.