Developer Experience: How to Measure and Improve It in 2026
June 10, 2026
Amir Tavafi
9 min read

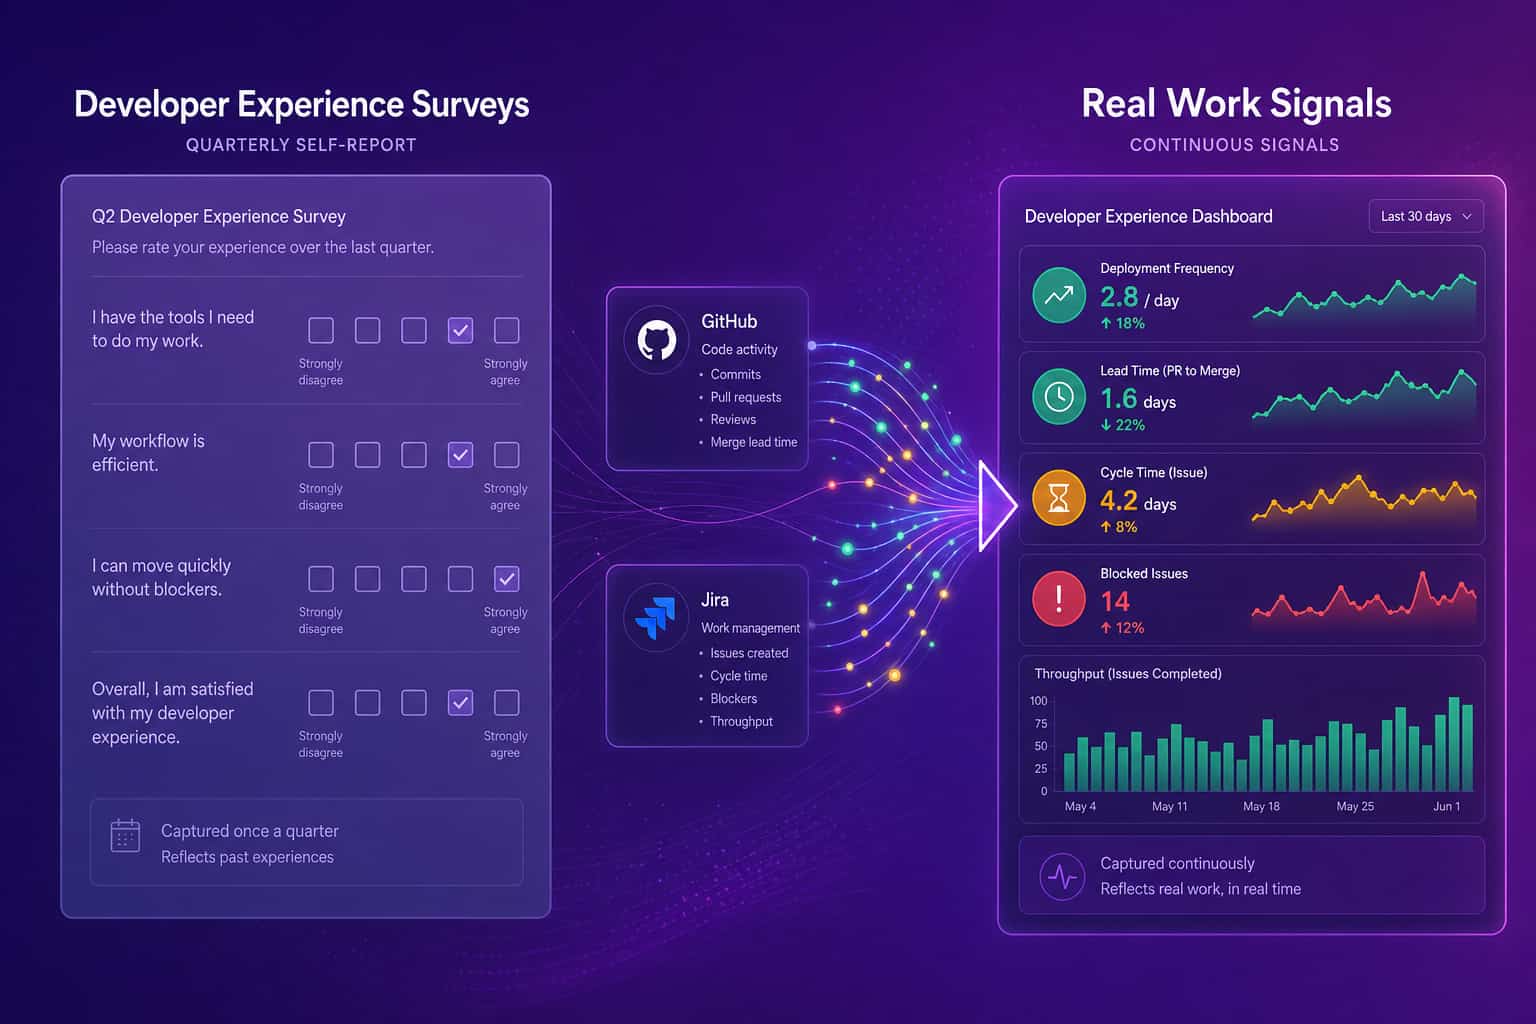
Developer experience is how it feels to ship code at your company: how fast feedback comes back, how often flow gets interrupted, and whether the tools help or fight you. It predicts both velocity and retention, yet most teams measure it once a quarter with a survey. Abloomify reads it continuously from the work engineers already produce in GitHub, Jira, and Linear, PII-free, with no screenshots and no keyloggers.
Key Takeaways
Q: What is developer experience?
A: Developer experience (DevEx) is the friction or flow engineers feel as they turn ideas into shipped code. It covers feedback loop speed, cognitive load, and flow state. Abloomify measures it from PR cycle time, review wait, and focus signals, not from a once-a-quarter survey.
Q: How do you measure developer experience?
A: Measure it from work signals engineers already generate: PR cycle time, review wait time, deploy frequency, context switching, and focus hours. Abloomify reads these from GitHub, Jira, Linear, and AI coding tools through APIs, so the picture is continuous and PII-free, not a quarterly snapshot.
Q: Are developer experience surveys still useful?
A: Yes, as one input, not the whole picture. Surveys catch sentiment that signals miss, but they lag by weeks and people round their answers. Pair a short pulse with continuous work signals so you see friction the week it shows up, not at the next quarterly review.
Q: How do AI coding tools affect developer experience?
A: Tools like Cursor, GitHub Copilot, and Claude Code can cut boilerplate or just generate more code to review. Abloomify separates human from AI agent contribution and ties usage to output, so you can tell whether the spend improves developer experience or adds review load.
What is developer experience, and why does it matter?
Developer experience, often shortened to DevEx, is the sum of everything that helps or hinders an engineer as they move work from idea to production. It is shaped by how quickly feedback arrives (CI runs, code review, deploys), how much the work fragments attention (context switching, meeting load, tool sprawl), and how often engineers reach real flow. It matters because it sits upstream of the two numbers leaders actually care about: delivery velocity and retention. Teams with fast feedback loops and protected focus ship more and quit less. The DevEx framework from the researchers behind DORA and SPACE makes the same point: productivity is not one metric, and friction compounds quietly until your best engineers leave.
This is why developer experience belongs on the same dashboard as engineering velocity, not in a separate HR survey. The experience is the leading indicator. The velocity number is the lagging one. Most teams stare at the lagging number and wonder why it is flat.
Why developer experience surveys keep lying to you
Quarterly developer experience surveys are the most common way teams try to measure DevEx, and they are the least reliable. Three things break them. They lag: by the time the Q3 survey flags slow reviews, two engineers already accepted other offers. They flatten: a single 1-to-5 score hides which team, which repo, and which week the friction lives in. And they get gamed: people round up before a reorg and round down before headcount planning, often without noticing they are doing it. None of this means sentiment is worthless. It means a number you collect four times a year cannot run an engineering org that ships every day. You need a read that updates as the work happens.
I have watched smart leaders make confident calls off a survey average that was already two months stale. The survey is a rear-view mirror. Useful for context, dangerous as your only instrument.
What work signals reveal developer experience without surveillance?
The signals that reveal developer experience are already in your systems, and you do not need to watch anyone's screen to see them. PR cycle time tells you how long work waits between opened and merged. Review wait time isolates the slowest, most morale-draining part of that cycle. Deploy frequency and change failure rate show whether shipping is smooth or scary. Context switching and meeting load show how fragmented the week is. Focus hours show whether deep work survives the calendar. Abloomify reads all of these from GitHub, Jira, Linear, and calendar metadata through APIs, with no screenshots, no keyloggers, and no screen recording. The result is a continuous, PII-free read on friction, the same visibility ActivTrak buyers want without the surveillance that makes engineers resent it.
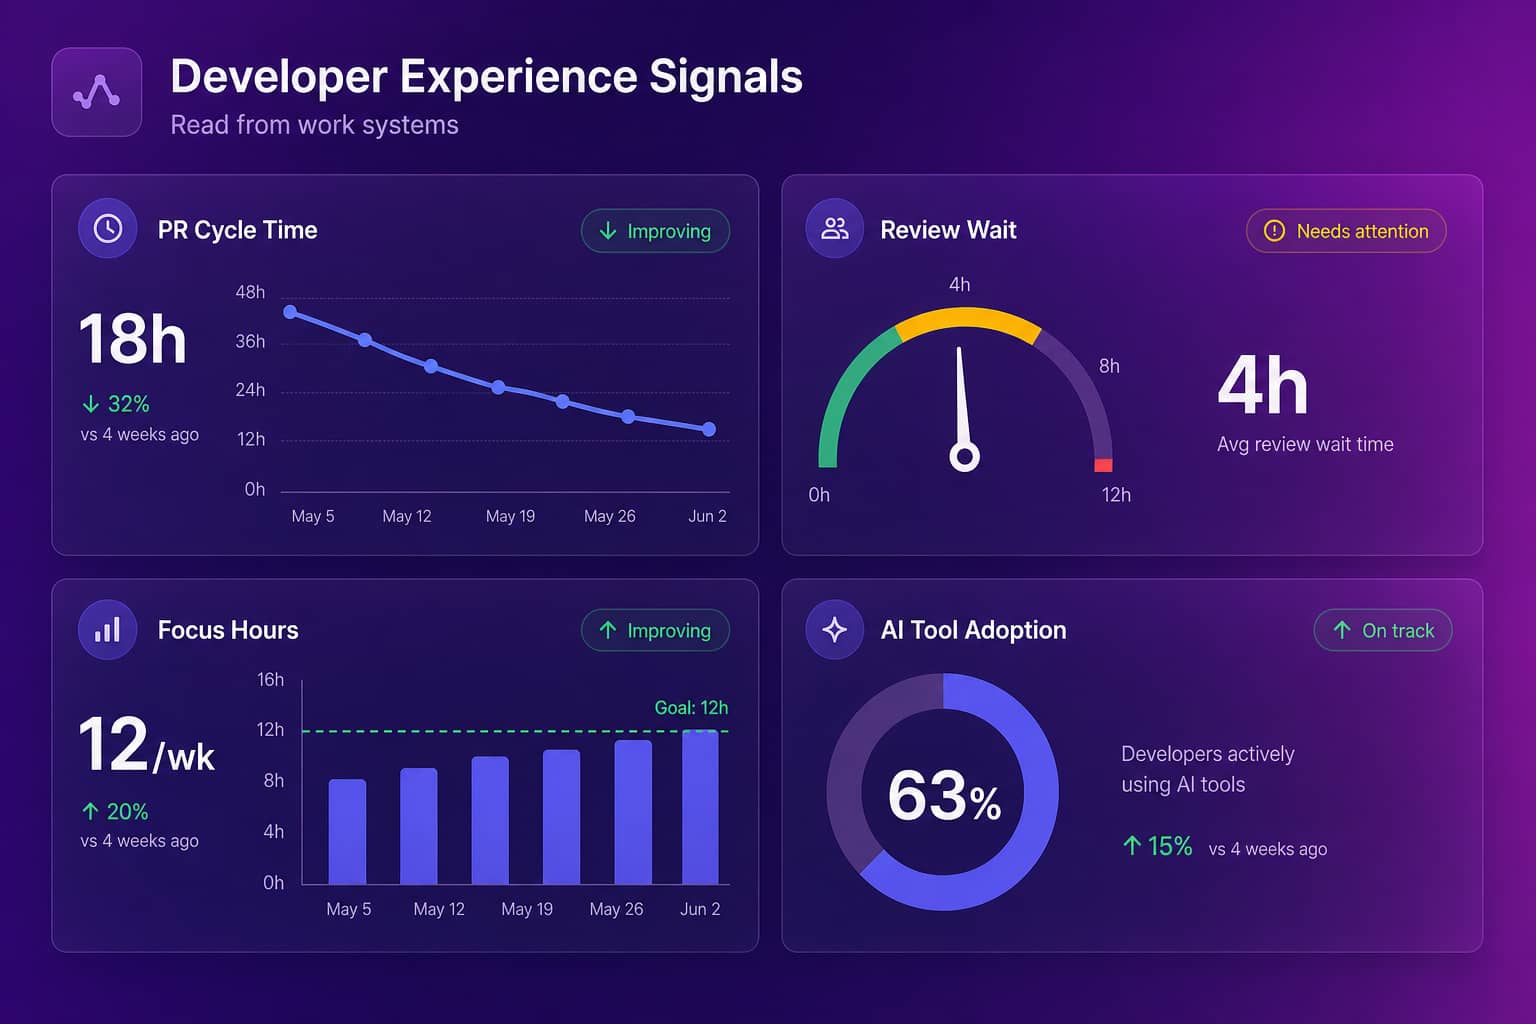
The longest pole is almost always review wait time. Code sits, the author loses context, and the rework gets harder. You can see it without reading a single line of code. For the full set of signals worth tracking, see our guide to developer productivity metrics, and for the privacy argument, how to measure productivity without screenshots.
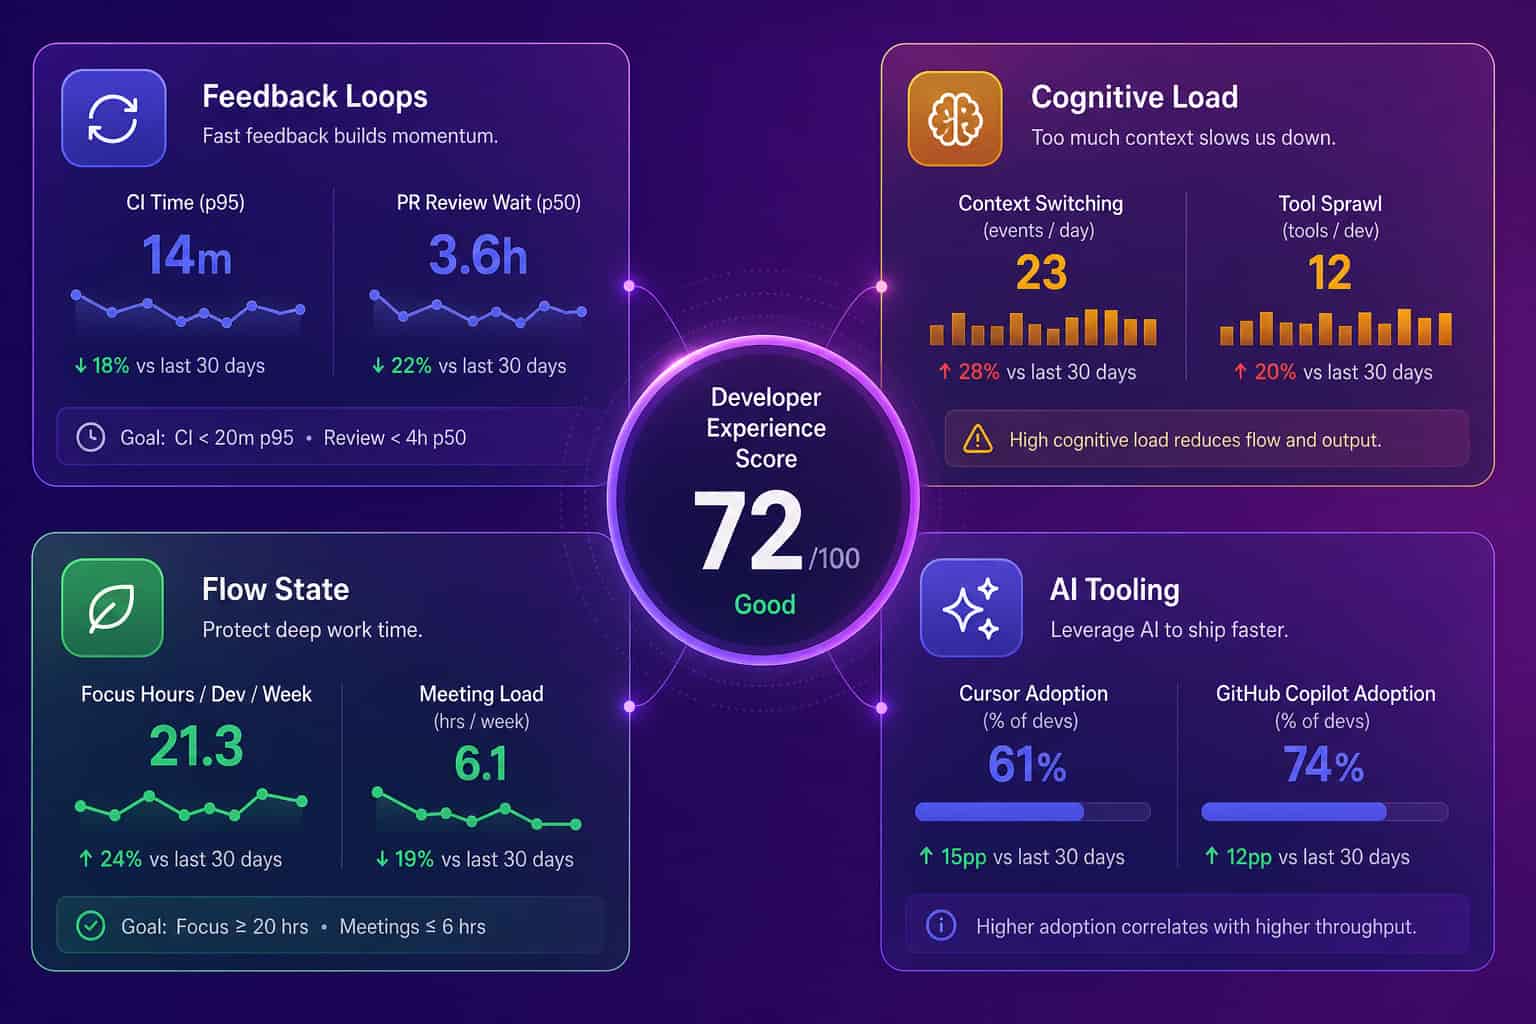
What actually shapes developer experience (four pressure points)
Four pressure points explain most of what engineers feel day to day, and each one maps to signals you can track. Feedback loops: slow CI and long review waits stretch the gap between writing code and knowing it works. Cognitive load: context switching across five tools and unclear ownership tax the brain more than the work itself. Flow state: focus hours get eaten by meeting sprawl and Slack, so the calendar, not the codebase, becomes the bottleneck. Tooling and AI: the editor, the pipeline, and now AI assistants either remove friction or add it. Fix the loudest pressure point first, measure whether the signal moves, then go to the next. That beats a generic engagement initiative that touches everything and changes nothing.
Notice what is not on this list: lines of code, commit counts, hours logged. Those measure activity, and activity is easy to fake and easy to misread. A senior engineer who deletes 400 lines of dead code looks lazy on a commit chart and just made everyone's experience better.
How AI coding tools changed the developer experience equation
AI coding tools rewired developer experience faster than any process change in the last decade, and not always for the better. Cursor, GitHub Copilot, and Claude Code can erase boilerplate and unblock a stuck engineer in seconds. They can also flood review queues with more code than the team can vet, which moves the bottleneck downstream and quietly degrades the experience for whoever reviews. The honest answer to "are these tools helping?" is "measure it." That means tying AI coding tool usage to output like PR cycle time, code velocity, and review load, and separating what humans built from what an agent generated. Most teams cannot do that yet, so they are flying blind on their fastest-growing line item.
When we switched our own team from Copilot to Cursor, it was the best tooling decision we made that year. The lesson was not "Cursor wins forever." It was simpler: try the new tools, give them a real shot, and measure the result instead of trusting the vendor's slide.
How to measure and improve developer experience
Improving developer experience is a loop, not a project: instrument the signals, find the loudest friction, fix one thing, and check whether the number moved. Start by connecting the systems engineers already use so you have a baseline for PR cycle time, review wait, focus hours, and AI tool adoption. Add a short quarterly pulse for the sentiment signals data cannot see, like clarity of direction or confidence in the codebase. Then run it like an operating cadence: review the signals every sprint, pick the single biggest drag, and assign an owner. Resist the urge to launch a ten-point DevEx program with a steering committee. The teams that win pick one pressure point, move it, and repeat.
- Connect the work systems. GitHub or GitLab, Jira or Linear, calendars, and your AI coding tools. This is the baseline for engineering productivity analytics.
- Baseline the four pressure points. Feedback loops, cognitive load, flow state, tooling and AI.
- Add a short sentiment pulse, not a 40-question survey. Five questions, asked often, beat forty asked rarely.
- Fix one friction per sprint. Usually review wait. Assign an owner, watch the signal.
- Separate human from AI contribution before you judge AI ROI. Otherwise you are scoring the tool on volume.
Surveys tell you how last quarter felt. Signals tell you how this week is going. Build the loop on the second one.
FAQ
What is a good developer experience metric?
The best developer experience metrics are delivery-oriented and team-level: PR cycle time, review wait time, deploy frequency, context switching, and weekly focus hours. They tie to outcomes you can act on, and they are hard to game. Abloomify reads them from GitHub, Jira, and Linear without reading code content.
How is developer experience different from developer productivity?
Developer productivity is about output: what the team ships. Developer experience is about the friction or flow on the way there. They are linked, because bad experience throttles output and burns people out, but you improve productivity by fixing the experience first, not by pushing for more commits or longer hours.
Can you measure developer experience without surveys?
Yes. Most of the signal already lives in your systems. Abloomify connects to GitHub, Jira, Linear, calendars, and AI coding tools through APIs and reads work signals, not content. No screenshots, no keyloggers, no screen recording. A short sentiment pulse can supplement the things signals cannot see, like clarity of direction.
Do AI coding tools improve developer experience?
Sometimes. Tools like Cursor, Copilot, and Claude Code can remove boilerplate or just flood review queues with more code to vet. Abloomify ties AI tool usage to output and separates human from AI agent contribution, so you can tell whether the tool actually helped or simply moved the bottleneck into review.
Amir Tavafi
Co-Founder & CEO
Product leader and innovator with over 15 years of experience in the tech sector, grounded in AI and robotics. Previously led product development in fraud detection and AI solutions at Nasdaq Verafin.