Engineering Velocity Metrics: A VP Engineering's Guide
April 7, 2026
Walter Write
3 min read

The metrics that matter
Not all engineering metrics are useful. Many create noise. Here are the ones that drive decisions.
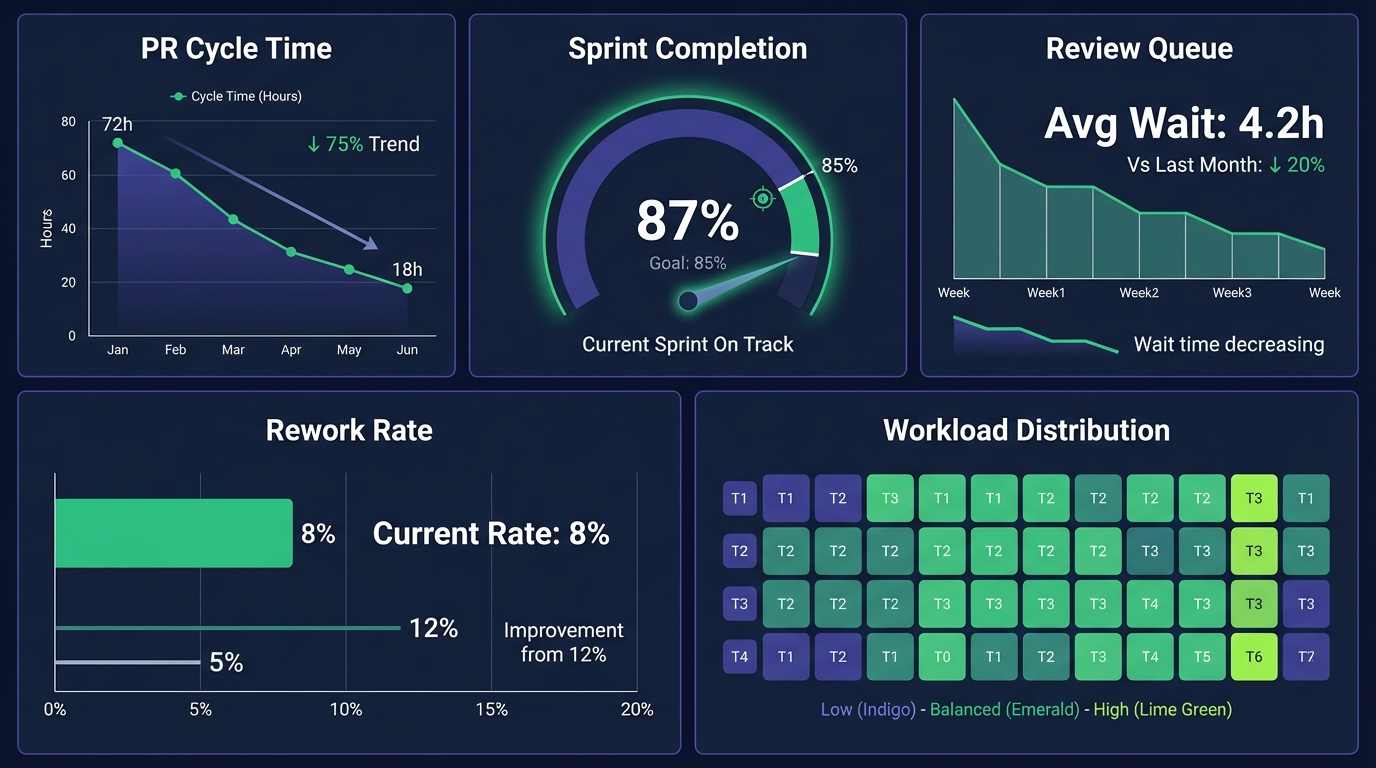
PR cycle time
Time from first commit to merge. This is your single best proxy for delivery velocity. Benchmark: under 24 hours for most PRs. If median cycle time exceeds 48 hours, you have a review bottleneck.
Sprint completion rate
Percentage of committed stories completed per sprint. Healthy range: 80-90%. Below 70% consistently means either scope creep, poor estimation, or external interruptions.
Review queue time
Time a PR waits for first review after being opened. This is where most cycle time is lost. Benchmark: under 4 hours. If it exceeds 8 hours regularly, you need to rebalance reviewer assignments.
Rework rate
Percentage of items reopened or reworked after merge. Healthy range: under 12%. Higher rates indicate quality problems that will compound.
Workload distribution
How evenly work is distributed across the team. If your top 10% of engineers produce 3x the output of the bottom 25%, you have a sustainability problem.
What not to track
- Lines of code (meaningless, gameable, punishes clean code)
- Commit count (incentivizes small, meaningless commits)
- Hours worked (measures presence, not output)
- Story points across teams (only meaningful within a team over time)
Beyond DORA: the full picture
DORA metrics (deployment frequency, lead time, change failure rate, MTTR) are valuable but incomplete. They miss the organizational context that explains why metrics change:
- Meeting overload: did meeting hours increase the same week cycle time spiked?
- Reviewer burnout: is one person blocking 60% of reviews?
- Context-switching: are engineers interrupted by support escalations?
- AI tool impact: are Copilot users actually shipping faster?
Abloomify connects DORA-style engineering metrics to organizational signals for the full picture—with live dashboards and Bloomy, the AI agent, for on-demand explanations (“Why did review queue time spike?”) instead of waiting for a static weekly export. It is not engineering-only software: Goals & OKRs, AI-enabled reviews, continuous feedback, and surveys live on the same platform, so velocity conversations connect to how the wider company runs performance management and AI governance. See engineering productivity analytics for details.
FAQ
How do we start tracking velocity metrics?
Connect GitHub/GitLab and Jira. Abloomify computes PR cycle time, sprint completion, review health, and workload distribution automatically. First data appears within days.
Will engineers resist being measured?
Engineers resist surveillance. They welcome data that helps them get more focus time, faster reviews, and fewer interruptions. Present metrics as team improvement tools, not individual scorecards.
How often should we review velocity metrics?
Sprint retros and leadership reviews should reference velocity trends on whatever cadence you already use. Abloomify keeps metrics current continuously, so conversations use live signal rather than a stale weekly snapshot. Monthly leadership reviews and quarterly strategic reviews still help connect velocity to business outcomes.
Bloomy for engineering leaders
Ask Bloomy for narrative context on bottlenecks, reviewer load, and cross-org factors (meetings, focus time) using up-to-date connected data.
See Bloomy in action
Capacity Planning
Do we have capacity to take on the Q3 roadmap?
How can I help?
What to read next
Walter Write
Staff Writer
Tech industry analyst and content strategist specializing in AI, productivity management, and workplace innovation. Passionate about helping organizations leverage technology for better team performance.