What Are DORA Metrics? A Practical Guide for Engineering Leaders
June 11, 2026
Amir Tavafi
10 min read

DORA metrics are four signals that measure how fast and how safely an engineering team ships software: deployment frequency, lead time for changes, change failure rate, and recovery time. They came out of Google's DevOps Research and Assessment program, and they have become the default scorecard for VP Engineering and CTO leaders. At Abloomify, we compute them from GitHub and Jira data, the same way Customer 1, a 50-person SaaS, replaced its manual spreadsheet tracking.
Key Takeaways
Q: What are DORA metrics in plain terms?
A: DORA metrics are four measures of software delivery performance: deployment frequency, lead time for changes, change failure rate, and recovery time. Two track speed, two track stability. Together they answer one question: can your team ship often without breaking things?
Q: Why do engineering leaders care about DORA metrics?
A: Because they tie engineering activity to outcomes a board understands. Deployment frequency and lead time show throughput. Change failure rate and recovery time show whether that speed is safe. Abloomify surfaces all four from GitHub and Jira without reading code content.
Q: What is a good DORA score?
A: Google's DORA research groups teams into elite, high, medium, and low tiers. Elite teams deploy on demand, ship in under a day, and recover from failures in under an hour. Your own trend matters more than the tier label.
Q: Can DORA metrics be gamed or misused?
A: Yes. Tie them to individual performance and engineers will split PRs, inflate deploys, and avoid risky work. DORA is a team-level health signal, not a stack rank. In 2026, AI coding agents also distort the numbers if you do not separate human from AI output.
What are DORA metrics?
DORA metrics are a set of four software delivery performance measures defined by Google's DevOps Research and Assessment team, which spent years studying what separates high-performing engineering organizations from the rest. The four metrics are deployment frequency, lead time for changes, change failure rate, and failed deployment recovery time. The first two measure throughput, or how quickly a team turns ideas into shipped code. The second two measure stability, or how often that shipping breaks production and how fast the team recovers. The insight that made DORA stick is that throughput and stability are not a trade-off. The best teams score well on both at once. That is why a single number like story points or lines of code never told the real story, and why DORA became the shared language engineering leaders use to talk about engineering velocity with the rest of the business.
DORA started as academic research and became the State of DevOps reports, an annual study of tens of thousands of engineers. The metrics are deliberately outcome-shaped. They do not ask how busy anyone looks. They ask how the system behaves.
The four core DORA metrics (and the fifth)
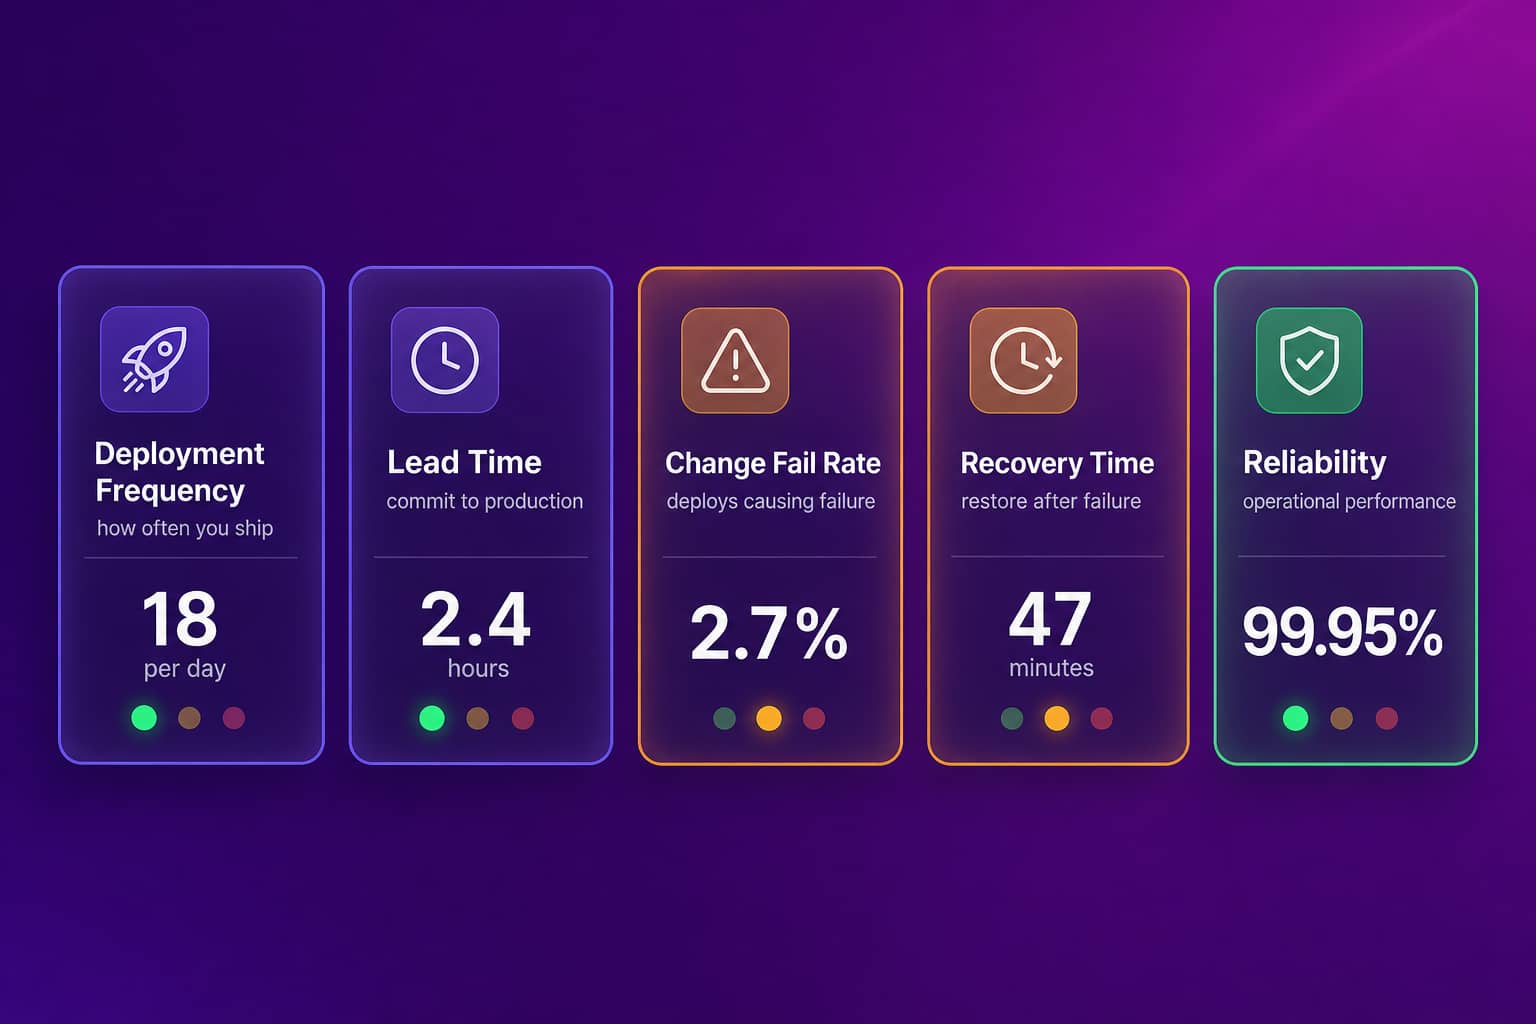
The four core DORA metrics split cleanly into throughput and stability, and a fifth metric, reliability, was added later to capture how software performs once it is live. Here is what each one measures and why it matters. Deployment frequency counts how often you push to production, from once a quarter to many times a day. Lead time for changes measures the clock from a commit landing to that commit running in production. Change failure rate is the percentage of deployments that cause a degraded service, a rollback, or a hotfix. Failed deployment recovery time, which older write-ups call time to restore or MTTR, measures how long it takes to recover once a change breaks something. Reliability, the fifth signal, asks whether the running service hits its availability and performance targets. The four delivery metrics tell you how you ship. Reliability tells you whether what you shipped holds up.
| DORA metric | What it measures | Type |
|---|---|---|
| Deployment frequency | How often code reaches production | Throughput |
| Lead time for changes | Commit to production duration | Throughput |
| Change failure rate | Share of deploys causing failure | Stability |
| Failed deployment recovery time | Time to restore after a bad deploy | Stability |
| Reliability | Whether the live service meets its targets | Operational |
A team that deploys daily but spends a third of its week firefighting failed releases is not high-performing. Neither is a team with a spotless change failure rate that ships once a month. You read the four together or you read them wrong.
DORA metrics benchmarks: elite, high, medium, low
Google's DORA research sorts teams into four performance tiers based on the four delivery metrics, and the benchmarks give you a rough yardstick rather than a hard target. Elite performers deploy on demand, often multiple times a day, ship changes from commit to production in under a day, keep change failure rate in roughly the 0 to 15 percent range, and recover from failed deployments in under an hour. High and medium performers stretch those windows out to days or weeks. Low performers measure lead time and recovery in weeks or months. The tiers are useful for a gut check, but they get misused constantly. A 12-person startup and a 3,500-person enterprise do not ship the same way, and chasing "elite" on a regulated payments service can be the wrong goal. The honest use of benchmarks is direction, not a leaderboard. Is your lead time trending down quarter over quarter? Is change failure rate stable as you ship more? Those answers matter more than the tier label.
How to measure DORA metrics without turning them into surveillance
You measure DORA metrics by reading the work signals your tools already emit, not by watching screens or counting keystrokes. Deployment frequency and lead time come from your version control and CI/CD pipeline: GitHub, GitLab, or Bitbucket plus your deploy system. Change failure rate and recovery time come from correlating deploys with incidents, rollbacks, and hotfixes, often joined with Jira or Linear. None of that requires looking at code content or installing a monitoring agent on anyone's laptop. This is the line that matters to me. The buyers who reach for employee monitoring tools to get engineering visibility end up with screenshots and keystroke logs that engineers resent and that tell you nothing about delivery. Abloomify connects through APIs and computes DORA metrics from PR and pipeline data. PII-free by architecture: no screenshots, no keyloggers, no screen recording, no code content read. The 50-person SaaS we work with validated our engineering numbers against their own manual analysis before they trusted the dashboard.
Where DORA metrics fall short, and what to pair them with
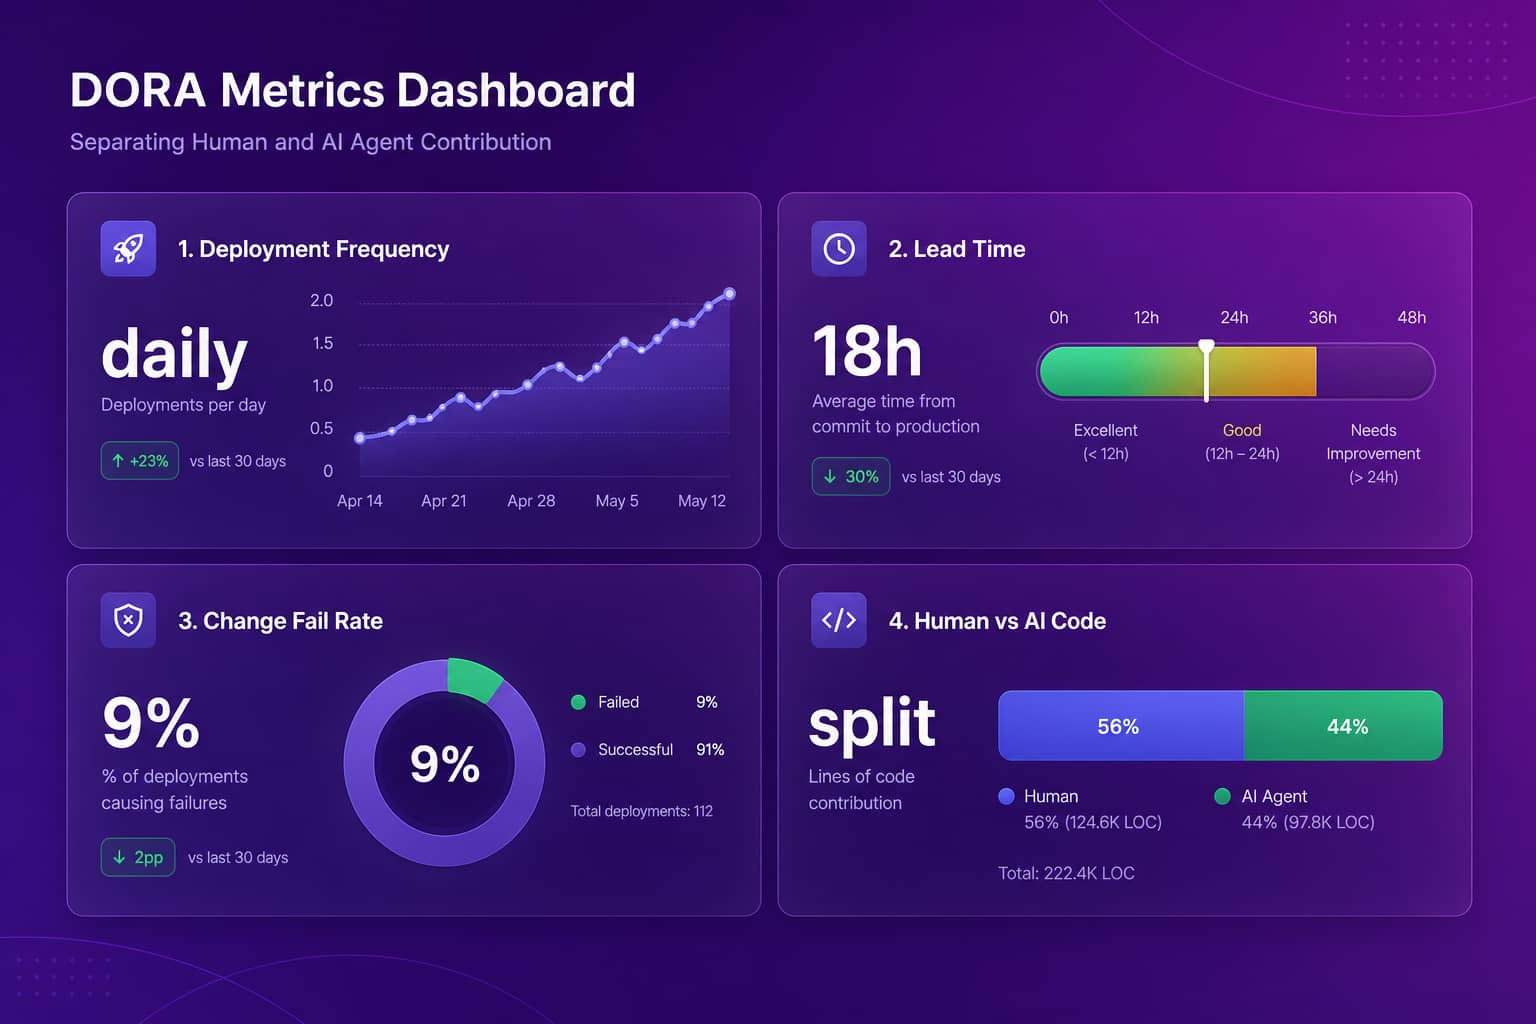
DORA metrics measure delivery, but they say nothing about capacity, focus, cost, or who actually wrote the code, which is why they work best as part of a wider picture. DORA will not tell you that two engineers are carrying 80 percent of the deploys while the rest sit in meetings. It will not flag that a team is one resignation away from a bus-factor crisis. And in 2026 it has a new blind spot: AI coding agents. When Cursor, Claude Code, or GitHub Copilot generate a large share of the diffs, deployment frequency and lead time can look great while human review load quietly balloons. If you cannot separate human from AI agent contribution, your DORA numbers describe a team that is partly a machine, and you will plan headcount and AI coding tool ROI on a fiction. Abloomify pairs DORA delivery metrics with capacity utilization, review health, workload balance, and a human versus AI agent contribution breakdown across tasks, code, and reviews. That is the difference between a delivery scorecard and actual engineering intelligence.
- DORA shows delivery, not capacity. Pair it with workload and meeting-load analysis.
- DORA shows speed and safety, not cost. Pair it with AI tool ROI and SaaS spend.
- DORA shows team output, not authorship. Pair it with human vs AI agent contribution.
How to improve your DORA metrics
You improve DORA metrics by shortening feedback loops, not by pushing people to deploy more for its own sake. Smaller, more frequent pull requests cut lead time and lower change failure rate at the same time, because small diffs are easier to review and safer to ship. Automated testing and a fast CI pipeline shrink the gap between commit and production. Trunk-based development and feature flags let teams ship continuously without long-lived branches piling up risk. And tightening code review cycle time often moves lead time more than any other single change, because review wait is where most PRs actually sit. The pattern underneath all of it is the same: reduce batch size and remove the waiting. Watch the trend, not the tier. Fix the bottleneck you can see, then measure again.
Engineering leaders do not need another vanity dashboard. They need to know where work bottlenecks, who is overloaded, and whether the AI tools they bought are paying off. DORA is the start of that answer. It is not the whole answer.
FAQ
What are the 5 DORA metrics?
The four core DORA metrics are deployment frequency, lead time for changes, change failure rate, and failed deployment recovery time. The fifth, reliability, was added to capture operational performance: whether the live service meets its availability and latency targets. The first four measure how you ship. Reliability measures whether what you shipped holds up in production.
What is the difference between DORA and SPACE metrics?
DORA measures software delivery performance through four delivery signals plus reliability. SPACE is broader, covering satisfaction, performance, activity, communication, and efficiency. DORA tells you how fast and safely your team ships. SPACE reminds you that developer productivity is more than one dimension. Most teams start with DORA because it is concrete, then add SPACE-style context as they mature.
Are DORA metrics good for measuring individual developers?
No. DORA metrics are team and system-level signals. Tie them to an individual's performance review and you create incentives to split pull requests, inflate deploy counts, and dodge risky work. Used at the team level, they expose process bottlenecks. Used as a stack rank, they corrupt the very data you are trying to read.
How does Abloomify calculate DORA metrics?
Abloomify connects to GitHub, GitLab, Bitbucket, Jira, and Linear through APIs and computes deployment frequency, lead time, change failure rate, and recovery time from PR and pipeline data. It reads work signals, not code content. No screenshots or keyloggers. It also separates human from AI agent contribution so your delivery numbers reflect what the team actually built.
Amir Tavafi
Co-Founder & CEO
Product leader and innovator with over 15 years of experience in the tech sector, grounded in AI and robotics. Previously led product development in fraud detection and AI solutions at Nasdaq Verafin.