How to Measure Engineering Velocity Without Destroying Team Morale
June 4, 2026
Reza Vatani
19 min read

Every engineering leader wants to know how fast their teams are really moving. The trap is that the most obvious ways to measure it, like keystrokes, commits, lines of code, and hours in the editor, read as surveillance, and the best engineers leave rather than work under a microscope. You end up keeping the people who cannot leave and losing the ones who actually drive the work. There is a better way. Privacy-first workforce intelligence connects to the tools your team already uses, like GitHub, Jira, and GitLab, and reads delivery patterns at the team level instead of watching individuals. This guide covers what to measure, what to stop measuring, and how to tie velocity to the business outcomes your executives track.
Key Takeaways
Q: What is engineering velocity?
A: The sustainable pace at which a team ships valuable, working software to production while keeping quality and team health intact. It is a property of team-level flow, not a tally of any one person's output.
Q: Why do traditional velocity metrics backfire?
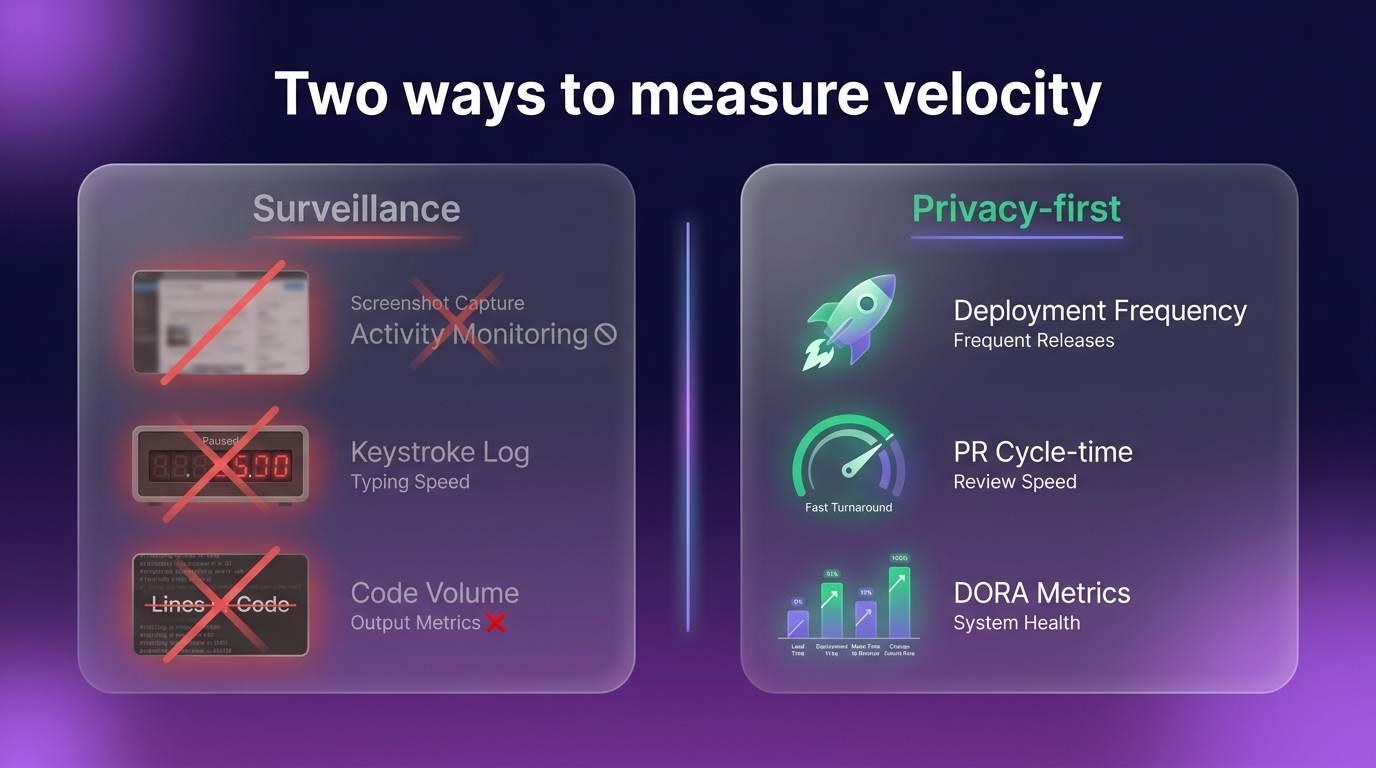
A: Output metrics like lines of code, commit counts, and keystrokes are easy to game and feel like surveillance. Engineers pad code, split commits, and chase easy tickets, and your strongest people start interviewing elsewhere.
Q: What should you measure instead?
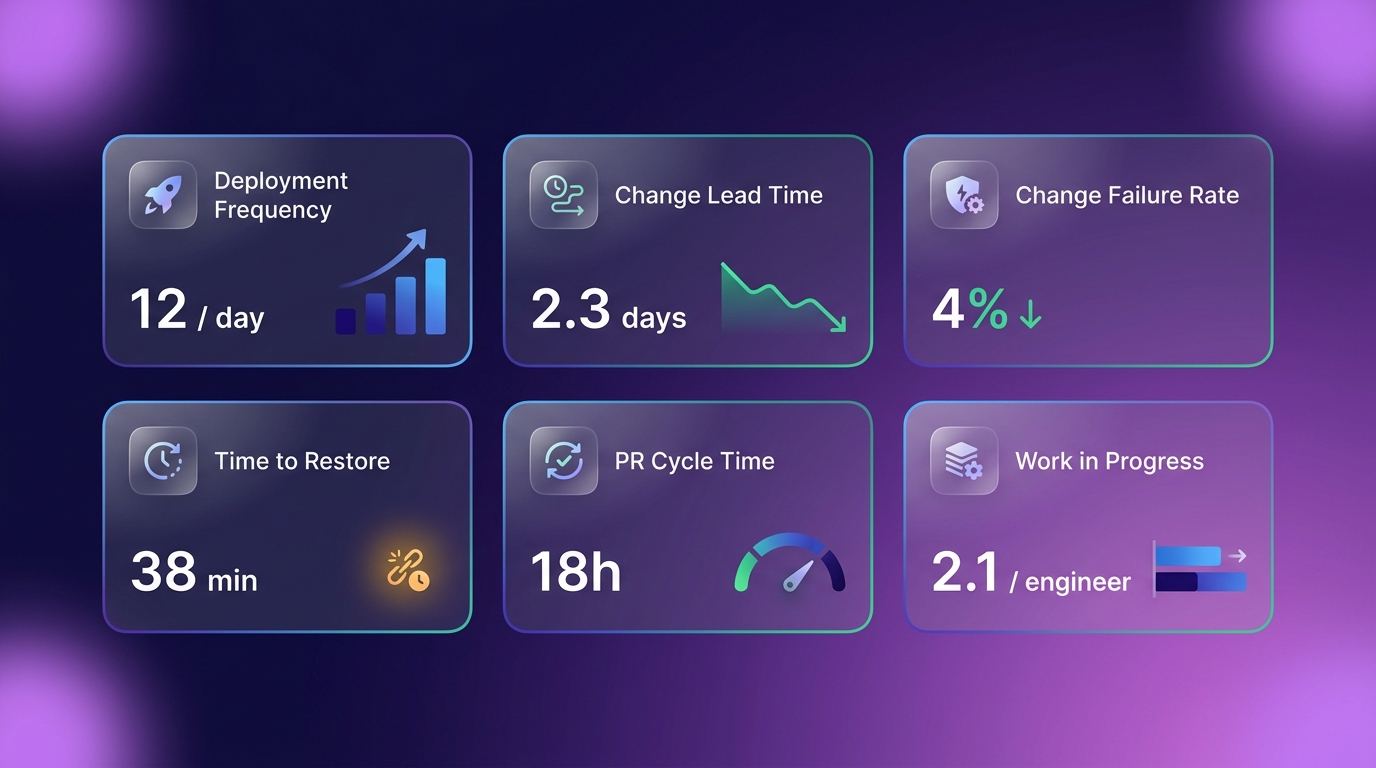
A: Team-level delivery and flow: deployment frequency, change lead time, change failure rate, time to restore, PR cycle time, review health, and work in progress. Aggregated and anonymized, never attributed to individuals.
Q: How do you do it without wrecking morale?
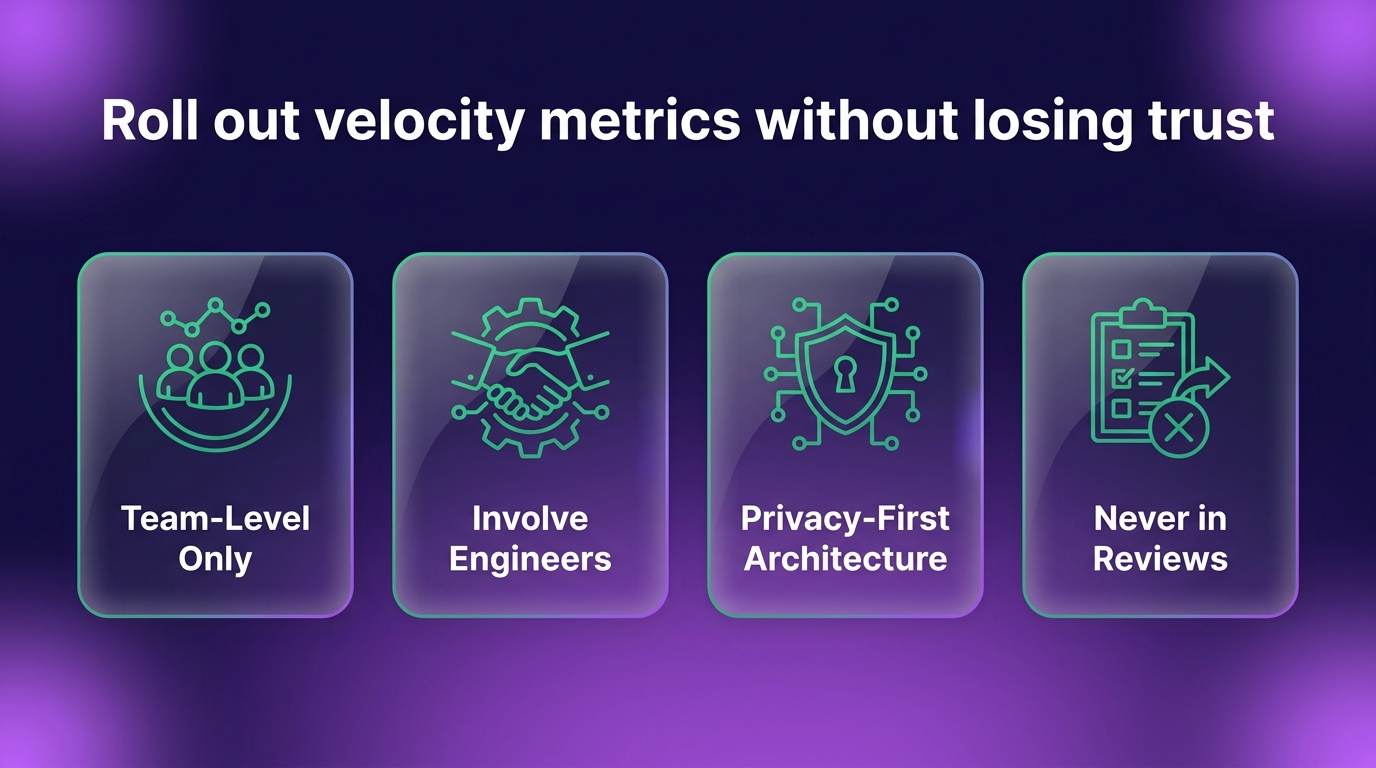
A: Keep metrics at the team level, never in individual reviews, involve engineers in choosing them, explain the why, and use privacy-first tooling that captures no screenshots, keystrokes, or PII.
Why traditional engineering velocity metrics damage team morale
Many tech leaders lean on output-based metrics like lines of code, commits per day, or ticket velocity. These create perverse incentives that erode psychological safety and trust. When engineers feel measured by tools that track keystrokes, screenshots, or time spent coding, motivation collapses and high performers start eyeing the exit.
Visibility without context reliably leads to gaming. Engineers write verbose code to inflate line counts, split meaningful commits into smaller chunks to boost frequency, or pick easy tickets over the complex problems that actually deliver value. These defensive habits lower real productivity while flattering the measured output. I have watched a team's commit count climb for a quarter while the things that actually mattered, review quality and deploy safety, quietly got worse. The number looked great. The engineering did not.
The damage runs deeper than gaming. Surveillance-based monitoring tells your team that leadership does not trust them. Top performers who could work anywhere leave rather than have every keystroke tracked, so you keep the people who cannot leave and lose the talent that drives innovation. The guide to measuring productivity without screenshots covers how to avoid these trust-destroying practices.
What engineering velocity really means in 2026
Engineering velocity is the sustainable pace at which teams deliver valuable, working software to production while maintaining code quality, team health, and innovation capacity. Real velocity is the flow of work through your entire development system, not a tally of individual output or raw speed.
Modern velocity balances speed with quality. The most useful metrics focus on outcomes: deployment frequency, change failure rate, mean time to restore service, and change lead time. These DORA metrics capture whether your team can deliver value to customers quickly while keeping the system stable.
Velocity also includes the collaboration dimensions that traditional metrics miss. PR cycle time, review health, work in progress limits, and capacity utilization across the full lifecycle all feed sustainable delivery. A team that ships fast but piles up technical debt, burns out engineers, or triggers production incidents is not actually moving at high velocity. It is borrowing speed from next quarter.
The difference between velocity and productivity
Velocity measures team-level flow and delivery rhythm. Productivity often narrows to individual output that misleads out of context. An engineer who writes less code may be more productive if they are solving harder problems, mentoring teammates, or deleting unnecessary complexity.
High velocity without quality leads to predictable trouble. Technical debt accumulates, incidents rise, and the team eventually slows under the weight of old shortcuts. You can ship fast for a quarter or two, but the bill comes due.
Privacy-first workforce intelligence tracks aggregate team patterns rather than individual activity. That reveals system-level bottlenecks and process issues without the fear and gaming that destroy trust, so leaders get the visibility to improve delivery without the morale cost of invasive monitoring.
Privacy-first metrics that actually improve engineering velocity
The best way to measure velocity starts with connecting to the systems your team already uses. Integrations with GitHub, Jira, GitLab, and project management tools capture workflow data without invasive monitoring. See how Abloomify integrates with GitHub for privacy-first velocity tracking that respects your team.
Focus on aggregated, anonymized metrics that reveal team patterns. Track PR cycle time, review latency, merge frequency, deployment cadence, and incident response time across the team rather than attributing every action to a person. The contrast that matters looks like this:
| Track this (team-level) | Drop this (individual) |
|---|---|
| Deployment frequency | Commits per day |
| Change lead time | Lines of code |
| PR cycle time and review health | Keystrokes or active hours |
| Change failure rate | Tickets closed per person |
| Work in progress and focus time | Time spent coding |
Code review health metrics add real velocity insight when measured correctly. Analyze review turnaround, approval patterns, comment quality, and revision cycles at the team level. You can spot when reviews become bottlenecks, when senior engineers carry too much review burden, or when feedback loops create needless churn. The developer productivity metrics guide goes deeper on balancing velocity with team health.
How to track PR cycle time without surveillance
PR cycle time measures the journey from opening a pull request to merging it into main. Watch it across the team to find bottlenecks in review assignment, feedback loops, and approval workflows. Long cycle times usually point to process issues, not individual performance problems.
Aggregated metrics surface patterns like large PRs sitting idle for days, review concentrating on a few people and creating single points of failure, or handoff delays between development and QA. When you spot these, the strategies in reduce PR churn and right-size diffs help.
The point is to use cycle-time data to improve the system, not to blame people. If PRs consistently wait three days for a first review, that is a process problem: maybe reviewers need protected focus time, automated assignment is not working, or the team lacks clear response-time expectations.
Measuring deployment frequency and change lead time
Deployment frequency tracks how often code moves from commit to production, which reflects both team velocity and the health of your CI/CD pipeline. Teams that deploy several times a day respond to customer feedback fast and fix issues quickly. Teams that deploy monthly move slower and carry more risk in each release.
Change lead time measures the full journey from idea through deployment, including planning, development, review, testing, and release. Long lead times often expose bottlenecks in non-coding activities like waiting for stakeholder approval, environment provisioning, or manual testing.
Compare deployment frequency and lead time across teams or sprints to find capacity constraints, process friction, or tooling gaps. A team that suddenly slows might be dealing with rising meeting load, context switching across too many projects, or technical debt that makes every change riskier. That lets you fix root causes instead of just demanding faster output.
Understanding work in progress and context switching
Work in progress metrics reveal when engineers juggle too many concurrent tasks. Monitor active branches, open PRs, and parallel work streams to detect the context switching that kills deep work and drags velocity down. Every switch costs time to cognitive reload and setup.
Aggregated WIP data shows when teams are spread too thin across too many initiatives. High WIP creates bottlenecks and cuts throughput even when everyone looks busy: five features in flight, nothing shipping, attention fragmented. Limiting WIP improves velocity by enabling focus, because fewer concurrent items means each one finishes faster and cleaner. The guide to reducing context switching in engineering teams covers WIP limits and capacity planning in depth.
How AI-powered workforce intelligence surfaces velocity bottlenecks
Bloomy, the AI analyst built into privacy-first platforms, lets engineering leaders ask natural language questions about velocity patterns without manual data work. Instead of building dashboards or writing SQL, you ask what you want to know and get answers backed by connected business data.
See how AI Chief of Staff capabilities make workforce data accessible to leaders who do not have time for heavy analytics. Ask "Which teams have the longest PR review times?" or "Where are deployment bottlenecks slowing releases?" and get an immediate answer.
AI also catches patterns manual analysis misses: review concentration on senior engineers, meeting overload eating coding time, tool-adoption gaps slowing delivery, or communication breakdowns creating handoff delays, all visible once the full context of your workforce data is in view. The engineering productivity analytics page shows how this supports data-driven leadership.
Detecting hidden capacity constraints
AI analysis reveals when engineers are overallocated across projects, stuck in too many meetings, or blocked waiting on reviews from specific people. These constraints slow velocity but stay invisible until someone looks across multiple data sources at once.
You can also spot underused capacity where a team could absorb more work or redistribute load. Maybe one team finishes sprints early while another grinds through constant overtime. AI helps balance capacity across the org for better overall velocity. The capacity planning guide covers techniques that balance velocity and team health, aiming for sustainable pace rather than maximum utilization that ends in burnout.
Identifying review health issues before they slow delivery
Watch review response times, approval bottlenecks, and feedback quality to protect velocity without sacrificing code quality. Long review delays force context switching as engineers move on while waiting, then lose time reloading context when feedback finally lands.
Catch it when review burden concentrates on a few senior engineers, which creates single points of failure and burnout risk. If three people handle 80 percent of reviews, they become the team's velocity ceiling. The burnout detection approach helps spot this before review load damages team health. AI can flag review-health problems early by reading patterns like a growing review backlog, declining comment quality, or longer gaps between review rounds, which buys you time to act before velocity drops.
How to connect engineering velocity data to business outcomes
Link deployment frequency, PR cycle time, and incident rates to product delivery milestones, customer satisfaction scores, and revenue targets. Executives care about velocity when you show how it drives the results they are accountable for.
Make the business value concrete. If cutting PR cycle time from five days to two ships a major feature three weeks sooner, calculate the revenue impact of earlier market entry. Use the same data to justify headcount, tool spend, or process changes: when you can show a 50,000 dollar CI/CD investment saves 200 engineering hours a quarter, the case makes itself.
Building executive dashboards that tell the velocity story
Create scannable visuals that connect engineering metrics to the business KPIs executives track, like revenue per employee, launch cadence, or churn. Leadership does not need PR cycle-time internals, but they do need to see how velocity moves the goals they are measured against.
Track OKR progress using real-time data across engineering and business teams. When velocity metrics roll up into company OKRs, velocity becomes a shared priority instead of an engineering-only concern. Show trends over time so a steadily falling change lead time or rising deployment frequency tells a story of engineering excellence that lands with business leaders.
How to measure AI tool impact on engineering velocity
Track adoption and effectiveness of AI coding assistants like GitHub Copilot, Cursor, Claude Code, and ChatGPT to understand their ROI. Plenty of companies spend heavily on these tools without ever checking whether they improve velocity or just add cost.
Compare Copilot vs Cursor for your teams by measuring changes in PR velocity, code quality, and time to first commit after rollout. Some teams see real gains, others see little, depending on use cases and adoption. Measure both adoption and effectiveness, because a tool only 30 percent of engineers actually use will not move company-wide velocity no matter how good it is. The guide to measuring AI adoption impact covers how to do this with workforce intelligence.
Detecting shadow AI that creates security risk
Identify when engineers use unapproved AI tools that create compliance, security, or IP risk. Shadow AI shows up when official tools do not meet developer needs, so people find their own without a security review.
The work on shadow AI risk detection and governance lays out strategies that balance innovation velocity with sensible guardrails. The goal is not to block every unapproved tool but to understand usage so you can offer better official options. Give engineers clear guidelines, easy access to approved tools, and a real explanation of why certain tools are off-limits, and shadow AI usage tends to drop on its own.
Implementing velocity metrics without triggering team resistance
Communicate the purpose of velocity tracking from the start. Emphasize team-level insight and continuous improvement over individual surveillance. Engineers support metrics when they understand the metrics exist to improve the system, not to punish people.
Involve engineering teams in selecting metrics, interpreting data, and designing improvement experiments to build ownership. When engineers help choose what to measure and how to respond, they are invested in the outcome rather than resistant to oversight. Use privacy-first architecture that never captures screenshots, keystrokes, or PII. The piece on privacy-first workforce analytics explains why this protects trust while still enabling data-driven decisions, because the architecture itself signals leadership's intent.
Creating psychological safety around performance data
Frame velocity metrics as team health indicators, not individual scorecards. The way you talk about a metric shapes how engineers read it. Discuss metrics in terms of process improvement and system optimization, and engineers treat them as tools rather than threats.
Share aggregated insights transparently, showing how data informs process changes rather than punitive action. When a team sees that velocity data led to removing a bottleneck or adding capacity, the value is obvious. Celebrate improvements as team achievements and bring engineers into problem-solving when bottlenecks appear. If PR cycle time drops 40 percent after the team reworks its review flow, name the collective effort that did it.
Training leaders to interpret velocity data correctly
Help engineering managers read the context behind metrics so they do not punish healthy practices like thorough code review. A week of low deployment frequency might mean the team did necessary refactoring, not that it was idle.
The roundup of performance management tools for engineering managers covers options that pair velocity metrics with qualitative context. The best leaders use data to ask better questions, not to jump to conclusions. Teach them to ask about system constraints when velocity drops: what changed in the environment, what obstacles appeared, what context affected the work.
Common engineering velocity mistakes tech leaders make
Measuring individual developer output instead of team flow creates competition, kills collaboration, and damages psychological safety. Engineers start hoarding information, avoiding help, and optimizing for personal numbers over team success.
Tracking vanity metrics like lines of code or commit frequency rewards quantity over quality and invites gaming. They are easy to measure and tell you almost nothing about real velocity or value. Rolling out velocity tracking without explaining the why breeds fear and disengagement, because metrics that appear with no context make engineers assume the worst. And comparing velocity across teams with different contexts, stacks, or maturity leads to unfair judgments and misallocated resources, since a team on a legacy system with heavy technical debt will always move slower than one building greenfield with modern tooling.
Why lines of code is a harmful metric
Lines of code punishes engineers who write elegant, maintainable code and rewards verbose implementations that pile up technical debt. Good engineering often means solving a problem with less code, not more.
Deleting code is frequently more valuable than writing it. Removing complexity, eliminating duplicate logic, and simplifying convoluted implementations all improve long-term velocity, yet LOC metrics make this valuable work look unproductive. Focus instead on outcomes like features delivered, bugs resolved, or user value created, which capture what matters to the business without the perverse incentives.
The danger of velocity metrics in performance reviews
Using velocity data for individual performance evaluation destroys trust, encourages gaming, and turns helpful insight into a weapon. Once engineers know velocity metrics affect their rating, they optimize for the metric instead of the actual work.
Keep velocity metrics at the team and organizational level, and use other approaches for individual development and career growth. The guide to building fair performance reviews balances data with human judgment, context, and qualitative assessment. Individual performance should account for what velocity metrics miss: mentorship, technical leadership, problem complexity, and collaboration quality. The engineers who appear to slow a team's velocity numbers are sometimes the most valuable people on it.
FAQ
What is engineering velocity and how is it different from productivity?
Engineering velocity measures the sustainable pace at which teams deliver valuable, working software to production while maintaining code quality and team health. It focuses on team-level flow and delivery rhythm. Productivity often focuses on individual output that can mislead without context. Velocity emphasizes outcomes like deployment frequency and change lead time rather than inputs like hours worked or commits made.
How can I measure engineering velocity without using invasive employee monitoring tools?
Connect to systems like GitHub, Jira, GitLab, and project management tools to capture workflow data. Track aggregated, anonymized metrics including PR cycle time, review latency, deployment cadence, and incident response time across the team. Use privacy-first workforce intelligence platforms that never capture screenshots, keystrokes, or personally identifiable information. Focus on team patterns and system bottlenecks rather than individual surveillance.
What are the most important engineering velocity metrics for tech leaders to track?
The most valuable metrics are deployment frequency, change lead time, change failure rate, and mean time to restore service. Also track PR cycle time, review health, work in progress levels, and context switching patterns. These reveal both the speed and the sustainability of your delivery process. Avoid vanity metrics like lines of code or commit counts that create perverse incentives.
How do I implement velocity tracking without damaging team morale or psychological safety?
Communicate clearly that metrics exist for team-level insight and process improvement, not individual surveillance. Involve engineers in selecting metrics and interpreting data. Use privacy-first architecture that respects team members. Share insights transparently and celebrate improvements as team achievements. Never use velocity data in individual performance reviews. Frame metrics as health indicators that help identify system constraints.
Can AI tools like GitHub Copilot actually improve engineering velocity or do they create new bottlenecks?
AI coding assistants can significantly improve velocity when adopted effectively, but impact varies by use case and team. Measure actual changes in PR velocity, code quality, and time to first commit after rollout. Track both adoption rates and effectiveness, since tools only help if engineers actually use them. Some teams see 30 to 40 percent gains on certain tasks while others find minimal impact. The key is measuring real outcomes rather than assuming benefits.
How do I connect engineering velocity metrics to business outcomes executives care about?
Link deployment frequency, PR cycle time, and incident rates to product delivery milestones, customer satisfaction scores, and revenue targets. Show how velocity improvements accelerate time to market and reduce operational costs. Calculate the business value of shipping features weeks earlier or avoiding production incidents that affect customers. Build executive dashboards that connect engineering metrics to company OKRs and the KPIs leadership is measured against.
What are the biggest mistakes tech leaders make when measuring engineering velocity?
The most common mistakes are measuring individual output instead of team flow, tracking vanity metrics like lines of code, implementing metrics without explaining the purpose, comparing teams with different contexts unfairly, and using velocity data in performance reviews. These damage trust, encourage gaming, and create the exact problems the metrics were meant to solve. Focus on team-level insight, communicate clearly, and use metrics for system improvement rather than individual evaluation.
How can workforce intelligence platforms track velocity without screenshots or keystroke logging?
Modern platforms connect to systems like GitHub, Jira, Google Workspace, Microsoft 365, and project management tools. They analyze workflow data, collaboration patterns, and delivery metrics without invasive device monitoring. Privacy-first architecture uses aggregated, anonymized data that reveals team patterns without tracking individual actions. Any optional device agent captures only high-level signals like application usage and focus time, never screenshots or keystroke logs. This provides actionable insight while keeping trust intact.
Reza Vatani
Co-Founder & CAIO
AI-driven entrepreneur with a strong background in robotics and advanced analytics. PhD from Old Dominion University and former Product Development leader at Nasdaq Verafin.