How Engineering Leaders Right-Size Sprint Capacity Without Overcommitting Teams
June 14, 2026
Amir Tavafi
21 min read

Every sprint planning session, the team commits to 40 story points and delivers 25. The pattern repeats. Burnout creeps in. Stakeholders lose trust. The root cause is rarely effort or skill. Capacity planning fails because it ignores how engineers actually spend their week.
Realistic sprint capacity means accounting for meetings, code reviews, bug fixes, and the hidden work that eats 40 to 50 percent of available hours. When leaders see true capacity and use workforce intelligence to surface the drains that never make it into Jira, teams deliver more predictably without overcommitting. This guide covers how to calculate realistic sprint capacity, prevent overcommitment, and improve delivery consistency with data.
Key Takeaways
Q: What is realistic sprint capacity?
A: The hours left for planned story-point work after subtracting meetings, code reviews, maintenance, collaboration overhead, and unplanned interruptions. For most teams that is 50 to 60 percent of theoretical hours, not 100 percent.
Q: Why does sprint capacity planning fail?
A: It treats velocity as the whole story, ignores hidden work, assumes every engineer and story point is interchangeable, and skips meeting load and context switching. Distributed teams and ramping hires add more constraints that simple math misses.
Q: How do you forecast capacity accurately?
A: Start with historical velocity and variance, adjust for PTO and team composition, reserve 15 to 20 percent for unplanned work, and use workforce intelligence to see the gap between planned Jira work and actual time in GitHub, Slack, and calendars.
Q: How do you prevent overcommitment?
A: Set sprint buffers, use WIP limits and pull-based planning, communicate capacity in business outcomes to stakeholders, and track leading indicators like sprint completion rate and unplanned work percentage before misses become a pattern.
Why sprint capacity planning fails in most engineering teams
Most teams treat sprint capacity as simple math: team size times hours per week, divided by average story point completion time, commit to that number. It breaks immediately.
The first mistake is relying solely on velocity. Velocity counts completed story points from past sprints but does not explain what consumed the rest of the hours. A team that delivered 30 points last sprint might have worked overtime to get there, making that number a bad baseline.
The second failure is ignoring hidden work. Engineers spend significant time on untracked activity: bugs that never make it into Jira, Slack questions, documentation, incident response, and cross-team support. None of it appears in velocity, but it can eat 20 to 30 percent of capacity.
The third issue is treating all engineers and story points equally. A senior engineer on architectural decisions has different capacity than a mid-level engineer on feature work. A 5-point story for one person might be an 8 for another based on domain knowledge and context.
Meeting overload and context switching create a fourth drain. Engineers in six hours of meetings per week cannot match the output of those with two. Research puts the refocus cost of an interruption at about 23 minutes. Teams that skip this fragmentation consistently overcommit. The guide to reducing context switching in engineering teams covers how to reclaim that lost capacity.
The fifth mistake is ignoring team-specific constraints. A distributed team across four time zones needs more async coordination than a co-located team. A team onboarding two junior engineers has less delivery capacity than a stable senior group.
What is realistic sprint capacity?
Realistic sprint capacity is the hours available for planned work after subtracting every competing demand on engineering time. It is not the theoretical maximum if everyone worked uninterrupted for 40 hours. It is what remains after meetings, maintenance, collaboration overhead, and unexpected interruptions.
The difference between theoretical and actual available hours
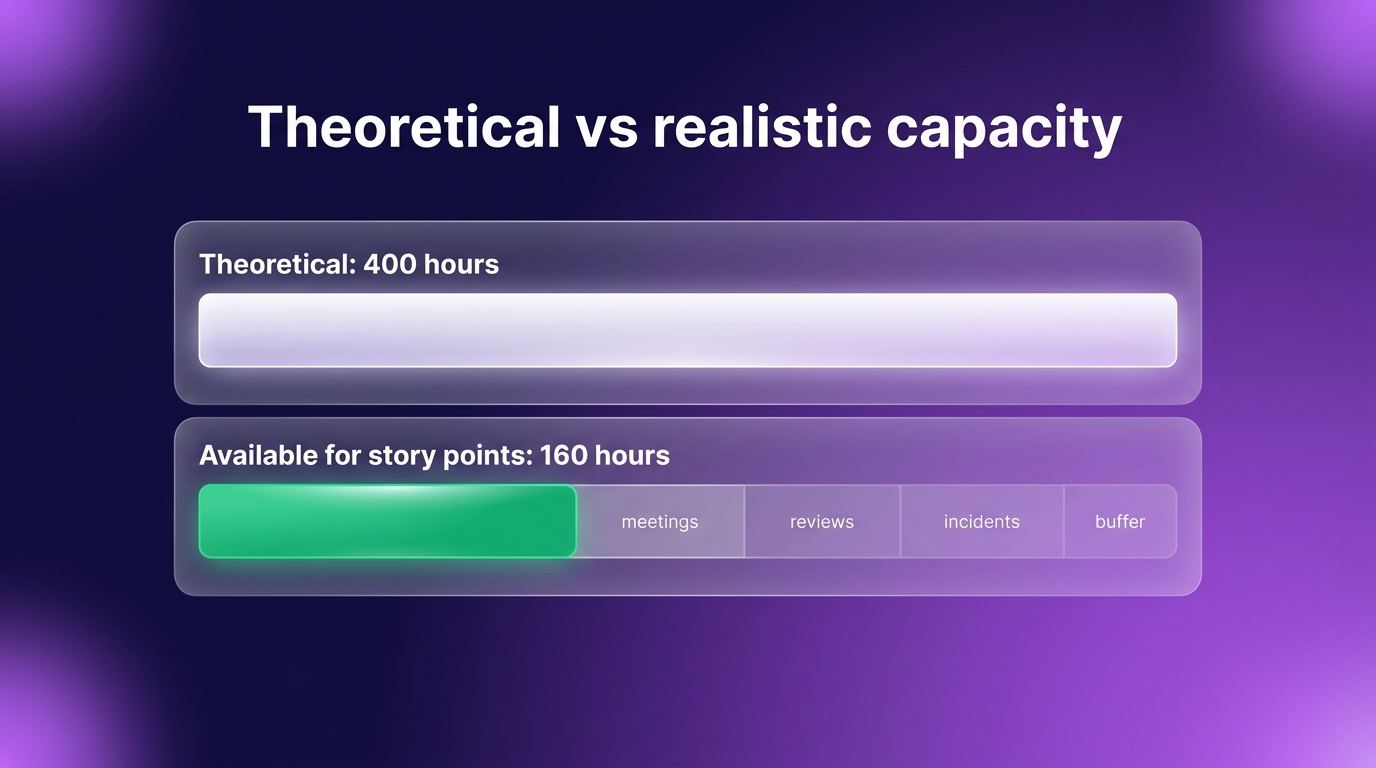
A five-person team working 40 hours per week has 200 theoretical hours per sprint. In practice, capacity for new story points often drops to 100 to 120 hours, roughly 50 to 60 percent of the total.
| Demand | Hours per engineer / week | Team total (5 people, 2-week sprint) |
|---|---|---|
| Meetings (standups, planning, 1:1s, reviews) | 8 to 12 | 80 to 120 |
| Code reviews | 4 to 6 | 40 to 60 |
| Incident response and production support | 2 to 8 (varies) | 20 to 80 |
| Knowledge transfer and documentation | 2 to 4 | 20 to 40 |
| Context switching, Slack, unplanned interrupts | ~15 to 20% of remainder | varies |
| Available for new story-point work | ~15 to 20 | ~100 to 160 |
Context switching, Slack, and unplanned interrupts rarely appear in capacity spreadsheets but materially cut output. After subtracting the visible drains, a team with 400 theoretical hours in a two-week sprint might have 160 hours for new story-point work. That is realistic capacity.
How to calculate true engineering capacity
Calculating true capacity means tracking planned and unplanned commitments over several sprints. Start with total available hours, then subtract known drains systematically.
The basic formula: total team hours, minus recurring meetings, minus maintenance work, minus knowledge transfer, minus a buffer for unplanned work, equals available capacity for new story points.
Concrete example for a five-person team in a two-week sprint. Total hours: 5 times 40 times 2 equals 400. Subtract 100 for meetings (10 per engineer per week). Subtract 40 for code reviews (4 per engineer per week). Subtract 20 for incident response based on last quarter's average. Subtract 30 for knowledge transfer and documentation. Subtract 50 as a 15 percent buffer for unplanned work.
Result: 400 minus 100 minus 40 minus 20 minus 30 minus 50 equals 160 hours for new story points. If the team averages 8 hours per story point, realistic capacity is 20 points per sprint, not the 50 theoretical hours might suggest.
Review this calculation every quarter as composition, product maturity, and meeting patterns change. New teams with heavy onboarding run lower. Mature teams with strong automation and documentation run higher.
How workforce intelligence reveals hidden capacity drains
Traditional capacity planning sees story points in Jira, commits in GitHub, and retrospective notes. Roughly 30 to 40 percent of engineering work stays invisible in those tools alone.
Workforce intelligence platforms like Abloomify connect to GitHub, Jira, Google Workspace, and Slack to surface hidden patterns: untracked bug fixes, ad-hoc support, documentation updates, and cross-team dependencies that never enter sprint planning.
An engineer might close three Jira tickets in a sprint and also fix five unreported bugs, answer 40 Slack questions, review 15 PRs, and join an emergency incident. Jira shows three completed items. Workforce intelligence shows where the hours actually went.
Meeting overload is another blind spot. Twelve hours of meetings in a week rarely get weighted in capacity planning. Workforce intelligence tracks meeting density, flags fragmented schedules, and highlights teams spending more time in meetings than writing code.
Cross-team dependencies create invisible bottlenecks. An engineer waiting three days for a security review shows zero productivity in Jira, but the delay is not their fault. Workforce intelligence identifies these process bottlenecks so leaders can fix the system.
Unplanned work patterns also emerge from connected data. If 25 percent of GitHub commits happen outside Jira tickets, that signals significant untracked work. If engineers consistently work late on Fridays to hit sprint goals, that points to chronic overcommitment.
Abloomify's GitHub integration tracks commits, PR activity, and review patterns to show where engineering time goes. Combined with Jira data, leaders see the gap between planned and actual work, then adjust capacity to match reality.
The advantage is aggregated, privacy-first metrics. No screenshots, no keystroke logging, just work patterns, collaboration overhead, and capacity utilization. Engineers know the measurement is fair, and leaders get the visibility to plan accurately.
How to forecast sprint capacity using historical data
Accurate forecasting starts with historical analysis. Completed sprints reveal delivery consistency, velocity trends, and capacity constraints that inform the next commitment.
Analyzing past sprint velocity trends
Velocity trends show how many story points a team consistently delivers. The goal is a sustainable baseline, not the highest sprint ever. Calculate average velocity over the last 6 to 8 sprints, then look at variance.
A team delivering 28, 30, 27, 29, 28, 31, 27, and 30 across eight sprints averages 28.75 with low variance. That is a reliable baseline. A team delivering 40, 22, 35, 18, 38, 20, 42, and 19 has a similar average but high variance, signaling unstable capacity or inconsistent planning.
PR merge rates add another view. If a team typically merges 60 PRs per sprint but last sprint merged 45, something changed: PTO, larger features, or a spike in incident load. That context adjusts future estimates.
Delivery consistency beats peak performance. Teams that reliably deliver 25 points per sprint are more predictable than teams swinging between 15 and 40. Stakeholders plan roadmaps better when capacity is stable. The guide to measuring engineering velocity covers how to do this without damaging morale.
Cycle time trends reveal constraints too. If PR cycle time rises from 2 days to 4 over three sprints, review is becoming a bottleneck that cuts effective capacity even when headcount stays flat.
Adjusting for team composition and availability
Historical velocity is a starting point. Every sprint has unique constraints based on who is available and what they are working on.
PTO and holidays reduce hours directly. Two engineers out a week in a two-week sprint costs 80 hours. Do not assume the rest absorb that load. Reduce commitment proportionally.
New hires ramp slowly. A junior engineer in their first sprint might deliver 30 percent of a senior's output while learning the codebase and practices. Build ramp curves into planning.
Senior engineers on architecture have different capacity than those on features. Architecture work is less predictable, often unblocks future sprints, and does not map cleanly to story points. If two seniors spend half a sprint on system design, cut their feature delivery capacity accordingly.
Part-time contributors carry communication and context-switching overhead that reduces efficiency below their hour count. An engineer at 20 hours per week on your team is not half a full-time contributor in story points.
Engineering leadership solutions help track composition changes and adjust forecasts based on who is available, their experience, and current workload distribution.
What role does AI play in capacity planning?
AI turns capacity planning from manual spreadsheet work into real-time, data-driven forecasting. Instead of compiling Jira, GitHub, and calendar data by hand, leaders ask natural language questions and get answers backed by connected business data.
Bloomy can answer "What is our team's realistic sprint capacity based on the last quarter?" by analyzing completed story points, PR merge rates, meeting hours, and unplanned work. It synthesizes across tools to show not just velocity but what drives variation.
Leaders can also ask "Which engineers have bandwidth for additional story points?" and get workload, meeting density, review obligations, and available hours. Sprint planning becomes data-informed instead of gut feel.
AI uses historical patterns to warn on risky commitments. If a team consistently delivers 80 percent of committed points when meetings exceed 10 hours per engineer per week, the AI flags a heavy-meeting sprint. If unplanned work typically consumes 20 percent of capacity, it recommends building that buffer in.
The AI Chief of Staff also surfaces drains manual analysis misses: 15 percent of time in cross-team dependency waits, or Friday afternoons with 40 percent lower commit activity suggesting fatigue or meeting overload.
AI improves over time as it learns team-specific patterns: stronger delivery in week one of a sprint, or a 30 percent capacity drop for two weeks after a major release due to support load.
The difference from traditional tools is context. AI does not just report that velocity dropped 20 percent. It explains that three engineers were pulled into incident response, two seniors spent a week on architecture, and meeting hours rose 30 percent for a planning workshop.
How to prevent overcommitment without under-delivering
Accurate capacity planning is not about committing to less work. It is about committing to the right amount so teams deliver consistently without burnout or missed deadlines. That requires buffers for unplanned work and controlled work in progress.
Setting sprint buffers for unplanned work
Every sprint includes unplanned work: urgent bugs, production incidents, security patches, and unexpected stakeholder requests. Teams that commit 100 percent of capacity to planned story points have no room for interruptions, which forces overtime and missed commitments.
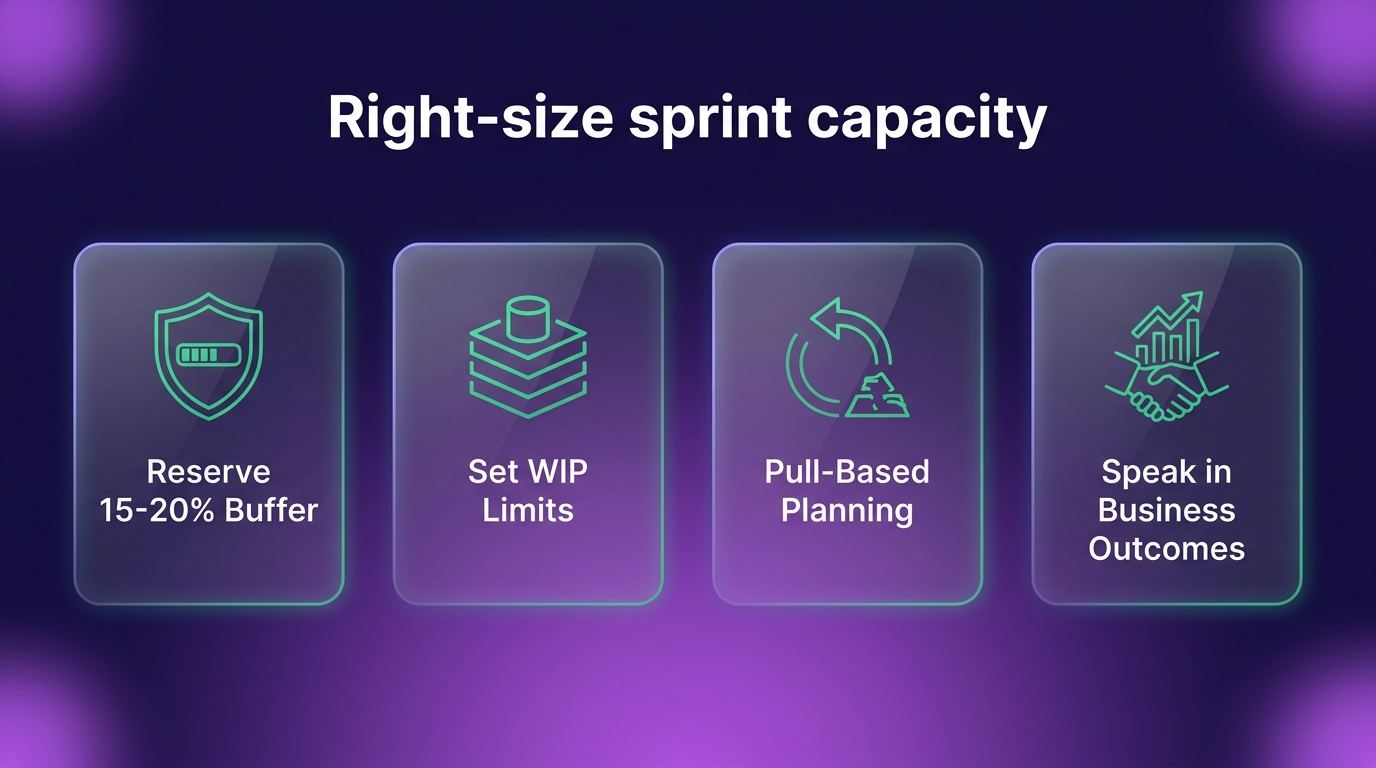
Reserve 15 to 20 percent of sprint capacity as a buffer. That is not padding. It is recognition that reactive work cannot be predicted two weeks out.
Calculate the percentage from history. Review the last 10 sprints and measure story points added mid-sprint, hours on unplanned bugs, and incident time. If unplanned work consistently takes 18 percent, reserve 20 percent.
For a team with 160 available hours, a 20 percent buffer means committing 128 hours to planned story points. The remaining 32 absorb interruptions. If unplanned work is lighter, pull from the backlog. If it exceeds the buffer, defer planned work explicitly.
Buffers also protect team health. Engineers at 100 percent capacity for weeks burn out. Slack in sprint planning gives room to learn, experiment, pay down debt, and improve systems without sacrificing delivery.
Using WIP limits and pull-based planning
Work in progress limits stop teams from starting too many tasks at once. When engineers juggle five or six open stories, context switching kills productivity. WIP limits force focus by capping active stories.
For a five-person team, a reasonable WIP limit might be 6 to 8 active stories. Each engineer works one primary task with a small buffer for pairing or unblocking. When someone finishes, they pull the next highest-priority ready item.
Pull-based planning adjusts better than push-based commitment. In push planning, the team commits to all sprint stories upfront. In pull planning, engineers take new work only when they have capacity, which naturally absorbs velocity variation.
WIP limits plus pull planning prevent queue overload. Backlogs stay prioritized without over-commitment. Engineers finish before starting. Teams discover sustainable capacity by watching what flows when WIP is limited.
Right-sizing work in progress also cuts PR churn and speeds review. Smaller, focused changes move through review faster than large PRs touching multiple systems.
How to communicate capacity constraints to stakeholders
Engineering leaders face pressure to commit to more story points than the team can deliver. Product wants faster releases. Executives want aggressive roadmaps. Sales needs customer commitments. The challenge is explaining constraints in terms stakeholders care about.
Translate capacity into business outcomes. Do not say "We can only commit to 25 points because of meeting overhead." Say "Committing to 25 instead of 40 raises on-time delivery from 60 to 90 percent, cuts escaped bugs, and prevents the attrition that follows chronic overcommitment."
Stakeholders care about predictability, quality, and stability, not story point counts. Show what overcommitment cost in past sprints: delayed releases, rising technical debt, emergency production fixes. Contrast with right-sized sprints that shipped smoothly.
Use visuals. Chart sprint completion rates over time. Show how meeting density correlates with velocity drops. Show unplanned work consuming 20 percent on average.
Walk stakeholders through a week in the life of an engineer. Ten hours in meetings, six in code review, four in incident response, two in documentation, three in Slack and email leaves about 15 hours for feature work. That is 37.5 percent of the week, not 100 percent. When people see the math, realistic estimates land better.
Involve product and executives in capacity discussions early. Share capacity trends quarterly. Explain how a platform migration or three new junior hires will temporarily reduce feature delivery. Give stakeholders time to adjust roadmaps and customer expectations.
Solutions for product teams help engineering and product leaders align roadmaps on available capacity instead of wishful thinking.
How to adjust capacity planning for remote and hybrid teams
Remote and hybrid teams carry different capacity considerations than co-located teams. Timezone distribution, async collaboration overhead, and meeting patterns change how much work completes in a sprint.
Teams across multiple time zones have limited synchronous hours. New York, London, and Singapore might overlap only 2 to 3 hours per day. That limits real-time pairing, immediate unblocking, and spontaneous problem-solving.
Async collaboration fills the gap but adds overhead. Engineers spend more time on detailed PR descriptions, documentation, and Slack context. Valuable work, but it consumes capacity that co-located teams might spend in conversation.
Remote teams often schedule more meetings to stay aligned, which fragments deep work. Meetings at 9am, 11am, 1pm, and 3pm leave four 2-hour blocks, not eight continuous hours. Context switching can cut effective capacity by 20 to 30 percent.
Hybrid teams add coordination complexity. Office-based engineers get easier access to casual conversations and whiteboard sessions. Remote members need extra time to stay in sync, which lowers their effective capacity unless you design for it.
Plan explicitly: allocate 10 to 15 percent more time for async communication and documentation, protect meeting-free blocks especially for low-overlap time zones, and use collaboration metrics to spot fragmented schedules.
Workforce intelligence helps optimize remote capacity by tracking meeting patterns, async overhead, and deep work availability across time zones. Hybrid and remote productivity solutions surface when teams need better async practices or fewer sync meetings to reclaim capacity.
What metrics should engineering leaders track for capacity planning?
Accurate planning needs leading indicators that show whether commitments match available capacity. Track these before overcommitment becomes habitual.
Sprint completion rate is the foundation. What percentage of committed story points ships by sprint end? Healthy teams hit 85 to 95 percent. Below 80 percent suggests chronic overcommitment. 100 percent every sprint might mean under-commitment or overtime forcing the number.
Velocity variance measures consistency. Standard deviation across the last 8 to 10 sprints: low variance means predictable capacity, high variance signals unstable planning or external disruption.
Unplanned work percentage tracks reactive load. Story points or hours on bugs, incidents, and urgent mid-sprint requests. Above 20 percent consistently means increase buffers or fix root causes like technical debt.
PR cycle time and review wait time reveal review bottlenecks. Rising cycle times cut effective capacity even when headcount is flat. The DORA metrics guide covers delivery performance in depth.
Meeting hours per engineer shows collaboration overhead. Above 10 to 12 hours weekly, deep work capacity drops sharply.
Deep work availability measures uninterrupted blocks. Engineers need 2 to 4 hour blocks for hard problems. Calendars with meetings every 90 minutes need capacity adjustments for fragmentation.
Developer productivity metrics help track these at the system level without surveillance pressure.
How Abloomify helps engineering leaders right-size sprint capacity
Abloomify is a privacy-first workforce intelligence platform that gives engineering leaders visibility into real team capacity, unplanned work patterns, meeting overload, and velocity trends without invasive monitoring.
The Abloomify platform connects to Jira, GitHub, Slack, and HRIS systems to track how engineering time is spent. It surfaces the gap between planned story points and actual work by analyzing commits, PR activity, code reviews, meeting patterns, and Slack collaboration.
Leaders answer questions like "What percentage of our team's time goes to unplanned work?" or "Which engineers have bandwidth for additional responsibilities?" Aggregated data across tools shows real constraints, not theoretical availability.
Bloomy answers natural language capacity questions using historical data. Ask "What is our realistic sprint capacity for next quarter given current meeting load and historical velocity?" and get a data-backed answer. Bloomy flags patterns like "Your team delivers 15 percent less when meeting hours exceed 12 per engineer per week" or "Unplanned work consumed 23 percent of capacity last quarter, up from 18 percent."
The Jira integration tracks sprint completion, velocity trends, and story point distribution. Combined with GitHub data, it shows which committed work completed versus which slipped mid-sprint.
Abloomify also identifies drains that sprint tools miss: meeting time, review workload distribution, incident response patterns, and cross-team collaboration overhead. Leaders see who is overloaded with meetings or reviews and rebalance before capacity collapses.
The platform uses privacy-first architecture: aggregated metrics, no screenshots, no keystroke logging. Engineers know measurement exists to improve team planning, not to score individuals.
That shift from guesswork to data-driven capacity planning improves sprint predictability, reduces burnout, and builds stakeholder trust through consistent delivery.
FAQ
How do you calculate sprint capacity for a new engineering team without historical data?
Start with industry benchmarks: assume 50 to 60 percent of total hours are available for new story points after meetings, code reviews, and unplanned work. For a 5-person team with 400 total hours per two-week sprint, plan for 200 to 240 hours of feature work. Run 3 to 4 sprints at conservative commitments while tracking where time actually goes, then adjust. Under-committing early and increasing capacity beats overcommitting and losing stakeholder trust.
What percentage of sprint capacity should be reserved for unplanned work?
Reserve 15 to 20 percent based on historical patterns. Review the last 8 to 10 sprints and calculate average time on urgent bugs, incidents, security patches, and mid-sprint priority changes. Mature products with strong test coverage might need only 10 to 15 percent. Teams carrying technical debt or rapid iteration might need 25 to 30 percent. Adjust quarterly as stability improves.
How can engineering leaders prevent overcommitting without disappointing stakeholders?
Communicate capacity in business outcomes, not story points. Show that realistic commitments improve on-time delivery, cut bugs, and prevent burnout. Use past sprint data to contrast overcommitted sprints that missed deadlines with right-sized sprints that delivered consistently. Involve stakeholders in quarterly capacity discussions so roadmaps adjust early. Frame it as predictability and trust, not saying no.
What is the difference between sprint capacity and team velocity?
Sprint capacity is the hours or story points a team can realistically commit to after subtracting meetings, reviews, and unplanned work. It is a forward-looking planning input. Team velocity is the average story points completed in past sprints, a backward-looking measurement. Use velocity to establish a baseline, then adjust for sprint-specific factors like PTO, ramping hires, or heavier meeting load.
How does remote work affect sprint capacity planning?
Remote work adds asynchronous collaboration overhead, timezone limits on synchronous work, and often more meetings that fragment deep work. Teams spend more time documenting context and writing detailed PR descriptions. Budget 10 to 15 percent additional capacity for async communication and protect meeting-free blocks for engineers in time zones with limited overlap.
Can AI tools help forecast sprint capacity more accurately than manual planning?
Yes. AI analyzes patterns across Jira, GitHub, calendar, and collaboration data that manual spreadsheets miss at scale. It surfaces correlations like velocity dropping when meeting hours exceed 12 per engineer, or unplanned work spiking after major releases. The best approach combines AI insights with engineering leader judgment on team-specific context.
How do you adjust sprint capacity when team members are ramping up or on PTO?
For PTO, subtract hours directly: one engineer out a week in a two-week sprint costs roughly 40 hours or 5 to 8 story points depending on velocity. For ramping hires, use a curve: about 30 percent capacity in month one, 50 in month two, 70 in month three, and 90 to 100 percent by month four. Do not expect the rest of the team to absorb full missing capacity. Communicate adjustments to stakeholders early.
Amir Tavafi
Co-Founder & CEO
Product leader and innovator with over 15 years of experience in the tech sector, grounded in AI and robotics. Previously led product development in fraud detection and AI solutions at Nasdaq Verafin.