Agile Metrics: Which Ones to Track and Which to Ignore
October 28, 2026
Amir Tavafi
10 min read

Agile metrics are the numbers a team uses to see how well it plans and ships software. Most teams track too many of them and trust the wrong ones. Abloomify's engineering productivity analytics read sprint data from Jira and PR flow from GitHub, which is where I would start before adding any chart that depends on someone updating a ticket.
Key Takeaways
Q: What are agile metrics?
A: Agile metrics measure how a team plans, delivers and improves software. They fall into four groups: predictability, flow, quality and value. A useful set has five or six numbers, each tied to a decision the team can actually make.
Q: Which agile metrics should I track first?
A: Sprint completion, cycle time, work in progress, change failure rate, and one value measure like feature adoption. Add time to first review if pull requests sit waiting. Abloomify reads the first four from GitHub and Jira, so no one has to estimate or enter anything.
Q: Why do velocity and story points mislead?
A: They are relative estimates, so they inflate as soon as they affect how people are judged. Velocity is fine for one team planning its own next sprint. Compared across teams or set as a target, it measures how generous the estimates are.
Q: How do I report agile metrics to leadership?
A: Give leaders flow and outcome numbers: cycle time trend, sprint completion, change failure rate and what shipped that customers used. Keep estimate-based charts inside the team. Abloomify's DORA bands (Elite, High, Medium, Low) give executives a stable reference without exposing individual contributors.
What are agile metrics, and what do they measure?
Agile metrics are measurements that help a software team see whether its way of working is producing reliable, good-quality, useful output. They are different from project management metrics like budget variance or milestone dates, because agile work changes scope often and a plan-vs-actual comparison misses most of what matters. In practice the metrics sort into four groups. Predictability asks whether the team finishes what it commits to, using sprint completion and scope change. Flow asks how fast and smoothly work moves, using cycle time, work in progress and aging items. Quality asks whether the work holds up, using change failure rate and escaped defects. Value asks whether anyone cares, using adoption, retention or the customer outcome the feature was meant to move. A team that only watches the first group ships on schedule and can still ship the wrong things.
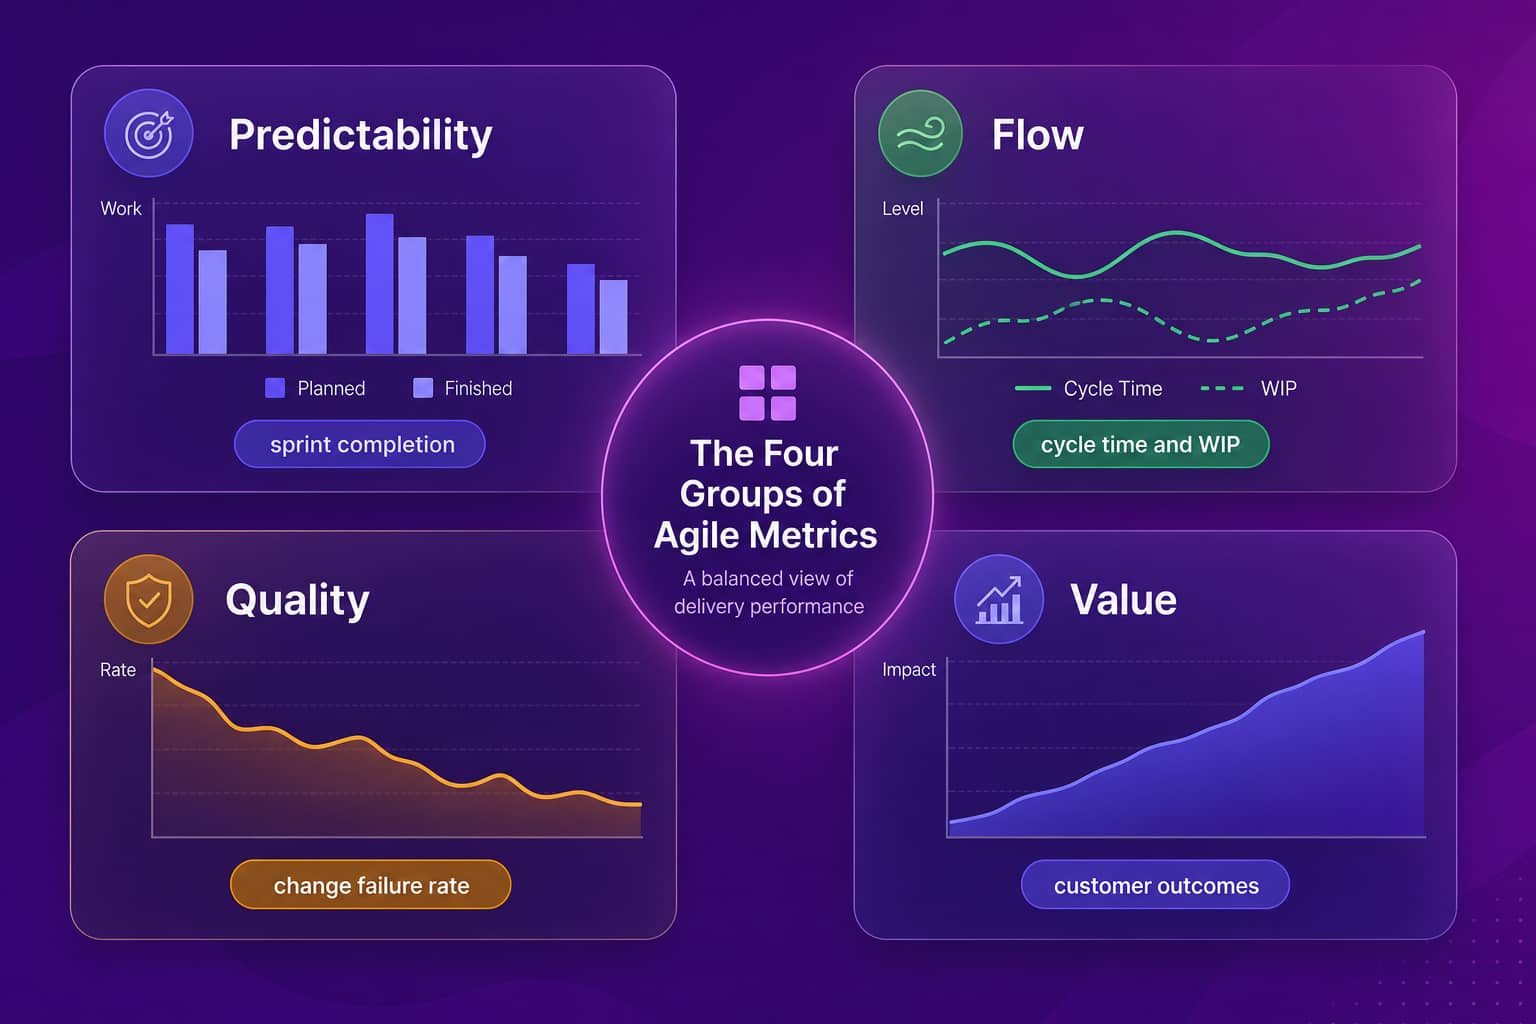
The groups matter more than the individual metrics. When you pick numbers, pick at least one from each, or you will optimize the group you can see and neglect the rest.
Which agile metrics are worth tracking?
The metrics worth tracking are the ones that come from the work itself and map to a decision. Cycle time (first commit to merge or deploy) shows where work waits. Work in progress shows overload before it becomes a missed sprint. Sprint completion shows whether planning is realistic. Change failure rate shows whether speed is costing quality. Time to first review points straight at the most common hidden delay in pull request based teams. For the value group, pick one measure per feature, such as the share of target accounts that used it in the first month, and keep it simple. Here is how the common ones compare.
| Metric | Group | What it tells you | Reliability |
|---|---|---|---|
| Cycle time | Flow | How long work takes once started | High, comes from repo activity |
| Work in progress | Flow | Whether the team is spread too thin | High, comes from board and PR state |
| Time to first review | Flow | How long PRs wait for a human | High, comes from GitHub |
| Sprint completion | Predictability | Whether commitments are realistic | Medium, depends on ticket hygiene |
| Change failure rate | Quality | How often a release causes a problem | High if incidents are tagged |
| Velocity | Predictability | Capacity for one team's planning | Low outside the team |
| Burndown | Predictability | Early warning inside one sprint | Low, depends on updates |
| Feature adoption | Value | Whether shipped work gets used | High, comes from product data |
Notice what the reliable rows have in common. They are read from systems of record. Nobody has to remember to update them, and nobody can quietly smooth them.
Why do estimate-based agile metrics mislead?
Estimate-based metrics mislead because they are produced by people, and people respond to how the numbers are used. Story points are a relative guess made before the work starts. They are useful when a team uses them privately to size a sprint. The moment velocity appears on a leadership slide, points get bigger, tickets get closed sooner, and the chart improves while delivery does not. This is Goodhart's law in a sprint board: when a measure becomes a target, it stops being a good measure. Burndown charts have the same weakness, since they only move when someone drags a ticket to done. Our guides to story points, team velocity and the burndown chart cover how each one fails. The Scrum Guide does not require velocity at all. Teams adopted it because it was easy to chart.
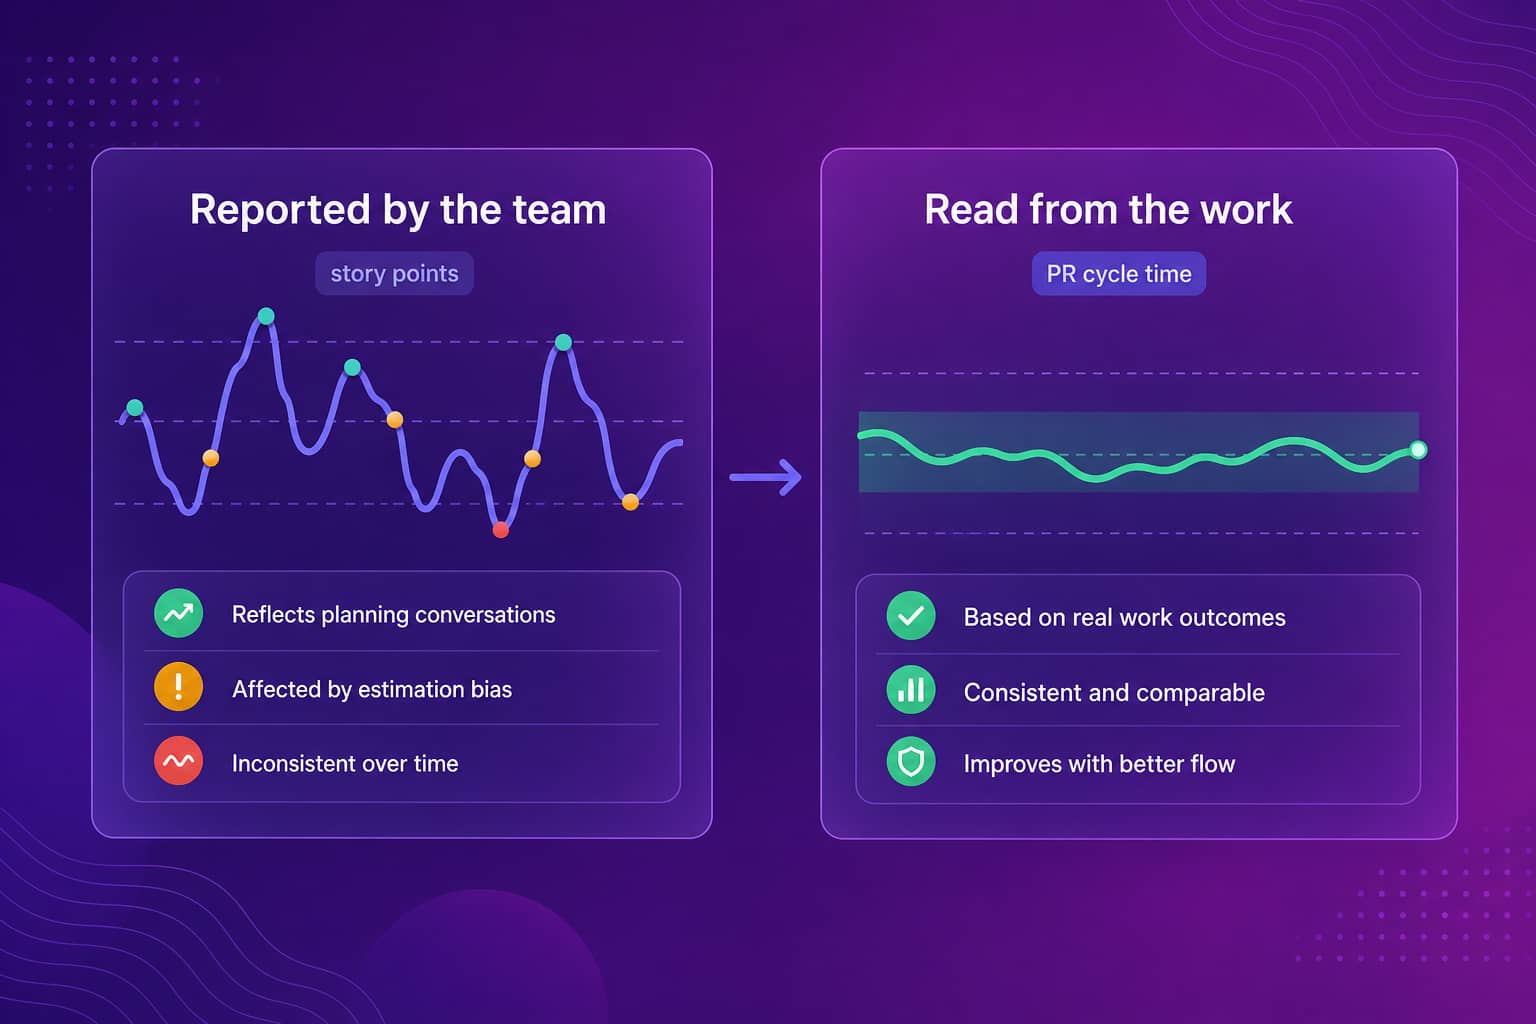
I think velocity is mostly fine and mostly harmless, until a VP asks for it every Monday. Then it turns into a negotiation about estimates, and the team spends real hours defending a number that was only ever a planning aid.
How do DORA metrics fit into agile metrics?
DORA metrics are a ready-made core for the flow and quality groups. They are four measures of software delivery from the DevOps Research and Assessment program: deployment frequency, lead time for changes, change failure rate, and time to restore service. Two of them describe speed and two describe stability, which keeps a team from buying one at the expense of the other. They are outcome measures rather than estimates, so they are hard to game without shipping something. If you are starting from nothing, adopt these four, then add sprint completion for predictability and one value measure. That gives you six numbers across all four groups. Our explainer on what DORA metrics are covers how each is calculated, and cycle time vs lead time explains where the clocks start, which is the most common source of confusion.
Flow tools sit nicely beside this set. A cumulative flow diagram shows where work piles up, and WIP limits turn that picture into a working rule.
How do you pick agile metrics for your team?
Pick the fewest metrics that cover all four groups, and tie each to a decision. Before adding one, ask what the team would do differently if the number moved. If the answer is nothing, drop it. Start by agreeing the problem you are trying to see: late releases point to predictability and flow, frequent hotfixes point to quality, and features nobody uses point to value. Then choose metrics that expose that problem, and keep them for at least a quarter so trends mean something. Review them in the sprint retrospective, not in a management meeting. Our sprint retrospective guide covers how to bring data into that conversation without turning it into a verdict on individuals.
For engineering leaders, the split is simple. Team-level numbers (velocity, burndown) stay with the team. Leadership sees flow and outcome numbers: cycle time trend, change failure rate, sprint completion, and what shipped that customers used.
How does Abloomify track agile metrics from real work?
Abloomify reads agile metrics straight from the tools engineering already uses, so nobody enters data. It connects to GitHub and Jira through API integrations and reports PR cycle time, review health, PR size and sprint delivery, with DORA metrics banded Elite, High, Medium and Low. It also separates human contribution from AI agent and bot contribution, which matters now that Cursor, Copilot and Claude Code generate a share of the pull requests that move through review. That split keeps cycle time honest, because an AI-assisted flood of small PRs and a human-written large one are different review problems.
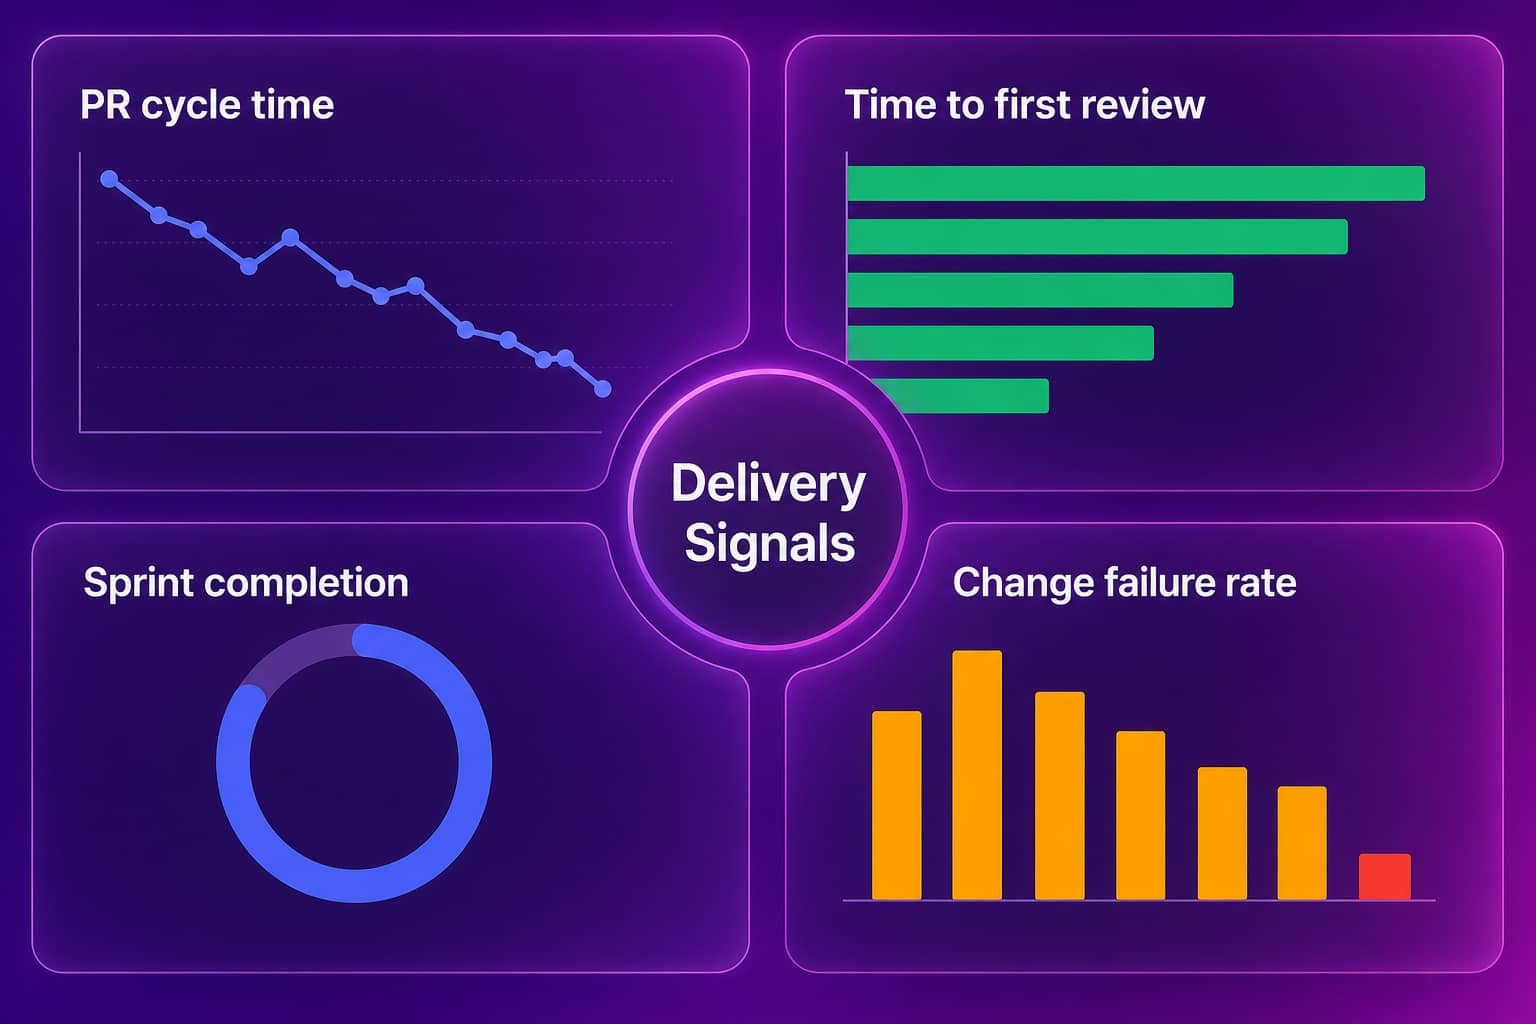
The architecture is privacy-first. Abloomify collects PII-free signals only, with no code content, no screenshots and no keyloggers, and it shows team-level flow rather than individual scorecards. The dashboard above is illustrative. If you want to compare it against what Jira already gives you, see Jira reporting for what the built-in reports answer and where they go quiet, and developer productivity metrics for the wider set.
How do you use agile metrics without damaging the team?
Use them to ask questions, never to rank people. Show trends rather than single points, keep individual numbers out of team dashboards, and tell the team up front which metrics leadership sees and which stay private. Do not compare teams on velocity or burndown, because their estimates are not comparable. Do not tie any metric to a bonus or a performance review, since that is the fastest way to teach a team to game it. When a number looks bad, start with the system: a long cycle time usually means large PRs or slow reviews, not slow people. And retire metrics that stop producing decisions. A dashboard with twelve stale charts teaches everyone to ignore the two that matter.
FAQ
What are agile metrics?
Agile metrics are measurements of how a team plans, delivers and improves software. They usually cover predictability (sprint completion), flow (cycle time, work in progress), quality (change failure rate, escaped defects) and value (whether shipped work gets used). Good ones guide team conversations. Bad ones become targets.
What are the most important agile metrics?
Start with a small set: sprint completion, cycle time, work in progress, change failure rate and one value measure such as feature adoption. Add time to first review if pull requests are the bottleneck. Five numbers the team understands beat fifteen nobody reads.
Is velocity a good agile metric?
Velocity is useful for one team planning its own next sprint. It breaks as a comparison or a target, because story points are relative estimates that inflate once they affect how people are judged. Use it for planning, and read cycle time for delivery speed.
What is the difference between agile metrics and DORA metrics?
Agile metrics describe how a team plans and flows work through a sprint. DORA metrics are four outcome measures of software delivery: deployment frequency, lead time for changes, change failure rate and time to restore service. DORA metrics are a good core to build an agile metrics set around.
How do you track agile metrics without adding admin work?
Read them from the tools the team already uses. Cycle time, review speed, PR size and sprint completion come from GitHub and Jira activity, so nobody fills in a form. Abloomify connects to both through API integrations and reports these signals without reading code content.

Amir Tavafi
Co-Founder & CEO
Product leader and innovator with over 15 years of experience in the tech sector, grounded in AI and robotics. Previously led product development in fraud detection and AI solutions at Nasdaq Verafin.