Team Velocity in Agile: What It Measures and What It Hides
June 22, 2026
Amir Tavafi
10 min read

Team velocity in agile measures how many story points a team completes per sprint. It is the most quoted number in engineering standups and the most misread. Velocity tells you a team's relative pace over time. It does not tell you whether real work shipped, who built it, or whether your AI coding tools changed anything. Abloomify reads delivery signals directly, so velocity stops being a story you tell and starts being something you can check.
Key Takeaways
Q: What is team velocity in agile?
A: Team velocity is the amount of work, usually counted in story points, that a team completes in one sprint. It is a planning signal used to forecast how much a team can take on next sprint, averaged across the last three to five sprints. Half-finished work counts for nothing.
Q: How do you calculate team velocity?
A: Add the story points of every work item the team fully completed in a sprint, then average that figure across your last three to five sprints to get a stable number you can plan against. A partly done item contributes zero points, not partial credit.
Q: Is team velocity a good performance metric?
A: No. Velocity is a forecasting tool, not a productivity score. Story points are relative and team-specific, so comparing velocity across teams or rewarding higher velocity just inflates estimates without shipping more. Abloomify tracks real delivery signals like PR cycle time and throughput instead.
Q: Can you compare velocity between two teams?
A: No. One team's 30 points and another team's 30 points mean different things, because each team sizes work on its own scale. Comparing them punishes honest estimators and rewards point inflation. Throughput of merged pull requests is a fairer cross-team signal.
Q: What should engineering leaders track instead?
A: Track delivery outcomes: PR cycle time, throughput of merged pull requests, review health, and the split between human and AI agent contribution. These signals are objective, comparable across teams, and show where work actually slows down.
What is team velocity?
Team velocity is the total amount of work a development team completes during a single sprint, almost always counted in story points. Scrum teams use it to forecast: if a team has averaged 32 points across the last four sprints, planning roughly 32 points into the next sprint is a reasonable bet. Velocity is a relative measure, tied to how one specific team estimates effort, so a team's own trend over time is the only valid comparison. One detail surprises most people. Velocity is not defined anywhere in the official Scrum Guide. It became standard practice through tooling and tradition, not the framework itself. That matters, because the number carries more authority in standups than its origins justify. Velocity is a planning aid. Treat it as a measure of output and you start optimizing the wrong thing.
The distinction worth holding onto: velocity describes a team's estimating pace, not the value that reached production. Two teams with identical velocity can ship wildly different amounts of working software. A team can also hold velocity perfectly steady while quietly slowing down, because the points were sized to fit the sprint rather than the work. The number looks stable. The delivery underneath it is drifting. That gap is the whole problem with leaning on velocity as your headline metric.
How do you calculate team velocity?
To calculate team velocity, add up the story points of every backlog item the team fully completed in a sprint, then average that across your last three to five sprints. Suppose a team closes items worth 8, 5, 3, 13, and 5 points in one sprint. Their velocity for that sprint is 34. Run the same sum across the previous sprints, say 30, 36, and 32, and the rolling average lands near 33. That rolling figure, not any single sprint, is what you plan against, because one sprint is too noisy to trust. The rule that trips teams up most: a work item only counts when it is fully done by the team's definition of done. An item that is 90 percent finished contributes zero, not 12 of 13 points. Partial credit is how velocity quietly inflates.
A clean calculation follows four steps:
- Agree on a definition of done that every team member applies the same way. Without it, "completed" means different things to different people and the number stops being comparable even within the team.
- Sum the points of only the fully completed items in the sprint. Leave carryover work out entirely until the sprint it actually finishes in.
- Repeat across the last three to five sprints and take the average. This smooths out holidays, incidents, and one large epic landing in a single sprint.
- Re-baseline after a change. New team members, a re-estimation exercise, or a shift in scope all reset the scale. Velocity from before the change no longer predicts after it.
Why team velocity is a weak performance metric
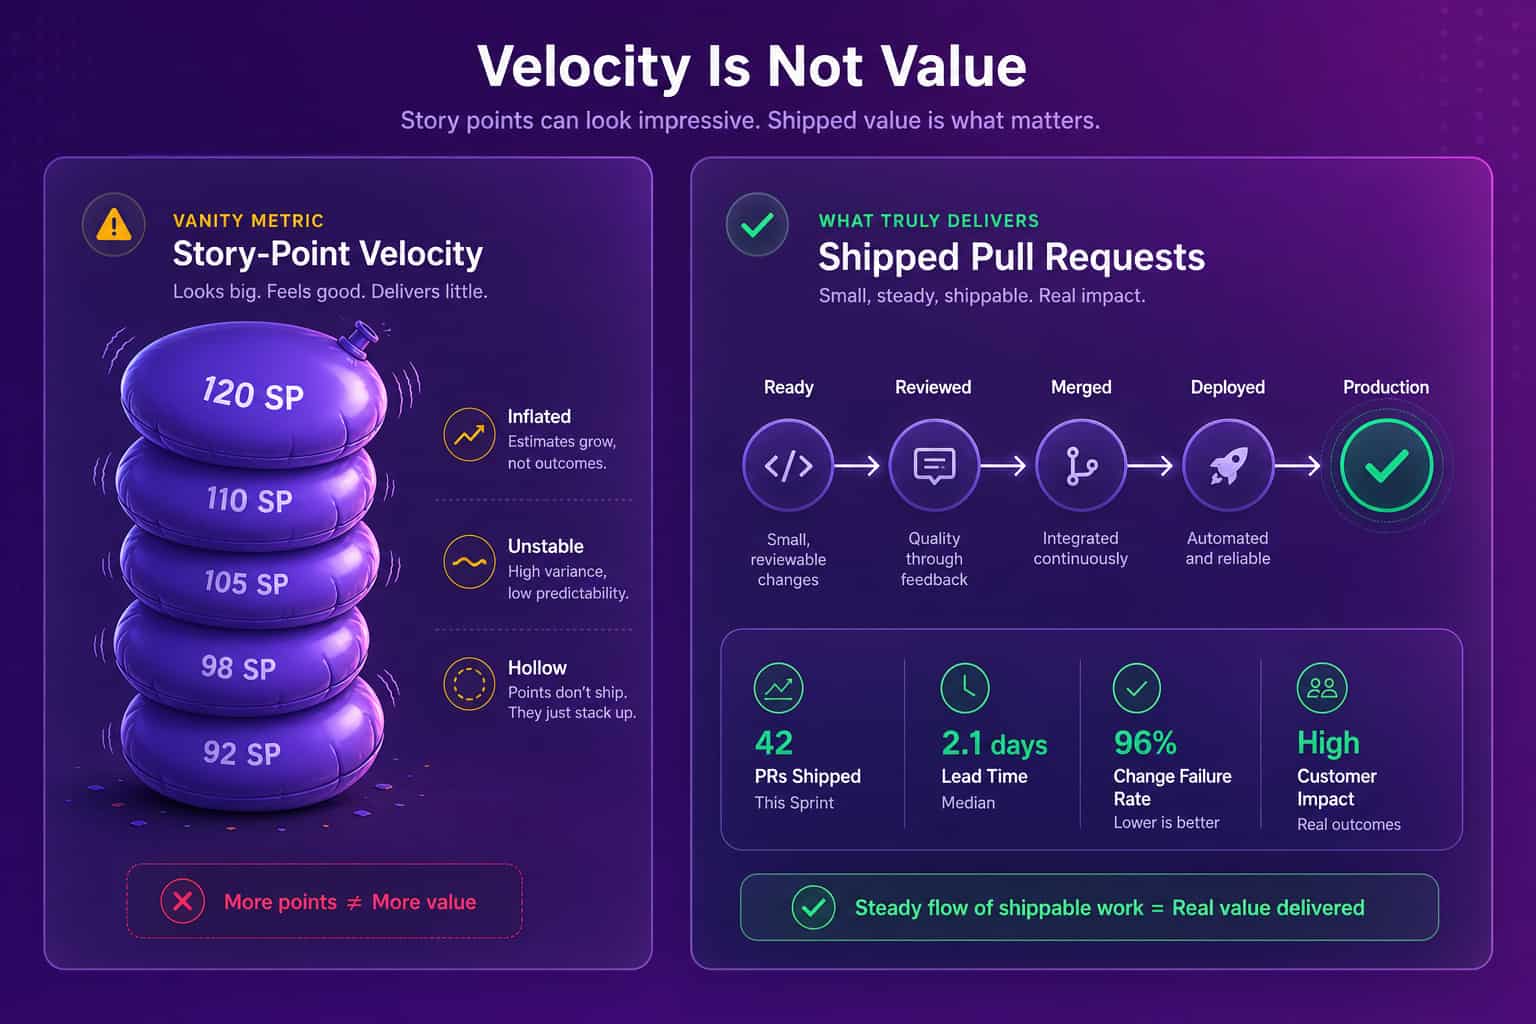
Team velocity fails as a performance metric because it was never built to measure performance, and the moment you treat it as one, people optimize the number instead of the work. This is Goodhart's law in its purest form: when a measure becomes a target, it stops being a good measure. Story points are relative estimates, not units of output, so a team under pressure to raise velocity can simply size the same work higher next sprint. Velocity climbs. Nothing more ships. Worse, comparing velocity across teams rewards the team that inflates points and punishes the team that estimates honestly, which is exactly backwards. Velocity also says nothing about quality, rework, or whether a pull request sat in review for three days. It counts what was estimated as done, not what was good. As a forecasting input for one team, velocity is genuinely useful. As a scoreboard, it actively misleads.
I have watched this play out. The teams that obsess over their velocity chart are rarely the teams shipping the most. They are the teams best at making the chart look right. Healthy teams treat velocity as a quiet planning number and point their attention at delivery: did the work reach production, did it hold up, and where did it get stuck on the way.
What to measure instead of story points
Measure delivery, not estimates. The signals that tell you whether a team is actually getting faster are objective, hard to game, and comparable across teams in ways story points never will be. Start with PR cycle time, the hours between a pull request opening and merging, because that captures real friction in review and handoff. Add throughput, the count of pull requests or work items actually merged per week, which needs no estimation and travels across teams cleanly. Layer in review health, how long work sits waiting for a reviewer, since that is where most "slow" teams are actually losing days. Then, in a world where Cursor, GitHub Copilot, and Claude Code generate a growing share of code, separate human from AI agent contribution so a spike in raw output does not get mistaken for a spike in value. These four signals answer the question velocity dodges: is working software reaching production, and where does it stall.
Story-point velocity
Delivery signals
None of this means delete velocity. Keep it for sprint planning, where a rolling average genuinely helps you commit to the right amount of work. Just stop asking it to do a job it cannot do. For the deeper version of this argument, see our guide to engineering velocity metrics for VP Engineering and the breakdown of DORA metrics, which formalize delivery and stability into four numbers boards actually understand.
How Abloomify measures team velocity without surveillance
Abloomify measures real delivery velocity by connecting to the tools your team already uses, with no screenshots, no keyloggers, and no reading of code content. It pulls signals from GitHub, GitLab, Bitbucket, Jira, and Linear, then layers in usage from Cursor, Claude Code, and GitHub Copilot, to show PR cycle time, review health, throughput, and an Engineering Velocity Score in one view. The piece most tools miss: Abloomify separates human versus AI agent contribution across tasks, code, and reviews, so a jump in output gets attributed correctly instead of inflating a velocity chart. Everything is PII-free by architecture, which is why engineers tend to accept it. The platform analyzes timing and patterns, not the contents of anyone's work. A 50-person SaaS customer validated Abloomify's engineering data against their own manual spreadsheet analysis, and their COO put it plainly: "What I did manually this week in a spreadsheet is exactly what I think Abloomify should be doing automatically."
For engineering leaders, that turns velocity from a number you defend in retros into delivery you can verify. You can see which teams are genuinely accelerating, which pull requests bottleneck in review, and whether your AI tool spend is translating into shipped work. Explore the engineering productivity analytics view, the broader tools built for engineering leaders, or read how to measure engineering velocity without destroying team morale.
Velocity charts make teams feel measured. Delivery signals make teams faster. Pick the one that ships software.
FAQ
Is team velocity the same as productivity?
No. Team velocity measures the relative pace at which one team completes estimated work, so it forecasts capacity for the next sprint. Productivity is whether valuable software actually shipped. A team can raise velocity by resizing story points without delivering more, which is why Abloomify pairs it with delivery signals like PR cycle time and throughput.
What is a good team velocity number?
There is no universal good number. Story points are relative to how a specific team estimates, so a stable, predictable velocity matters far more than a high one. A team averaging 30 points with low variance is healthier than one swinging between 20 and 60. Look for consistency across three to five sprints, not a target figure.
How many sprints does it take to establish team velocity?
Most teams need three to five completed sprints before velocity stabilizes enough to plan against. Earlier than that, estimates are still settling and one large or interrupted sprint distorts the average. Use a rolling average of the last three to five sprints, and re-baseline after team or scope changes.
How do AI coding tools change team velocity?
AI tools like Cursor, GitHub Copilot, and Claude Code can generate more code faster, which can inflate raw output without improving delivery. Velocity alone will not tell you if the gain is real. Abloomify separates human versus AI agent contribution across tasks, code, and reviews so you can see whether the tools actually moved shipped work.
What is the difference between velocity and throughput?
Velocity counts estimated story points completed per sprint and is team-specific. Throughput counts the actual number of work items or pull requests finished in a period and needs no estimation. Throughput is more comparable across teams because it does not depend on each team's point scale, which makes it a stronger delivery signal.
Amir Tavafi
Co-Founder & CEO
Product leader and innovator with over 15 years of experience in the tech sector, grounded in AI and robotics. Previously led product development in fraud detection and AI solutions at Nasdaq Verafin.