Cycle Time vs Lead Time: What Each Measures and Which to Track
October 1, 2026
Amir Tavafi
10 min read

Cycle time vs lead time comes down to one question: where does the clock start? Lead time starts when someone asks for the work. Cycle time starts when someone begins it. Abloomify's engineering productivity analytics compute both from GitHub and Jira activity, so you can see where a change spent its days instead of arguing about definitions in a retro.
Key Takeaways
Q: What is the difference between cycle time and lead time?
A: Lead time runs from the request to delivery, and it is what your customer experiences. Cycle time runs from the moment work starts to the moment it is done, and it is what your team controls. Lead time always includes cycle time plus the waiting before work begins.
Q: Which one should an engineering team track first?
A: Cycle time. The data is already in your repos, the team can move it within a quarter, and it exposes review delays quickly. Abloomify reports PR cycle time, time to first review, and PR size from GitHub. Add lead time once you want to see how long ideas sit in the queue.
Q: How do DORA metrics define lead time?
A: DORA uses lead time for changes: commit to production. That is a narrower window than the product-management definition. Abloomify computes all four DORA metrics from GitHub and bands each one Elite, High, Medium, or Low, so the definition stays consistent across teams and quarters.
Q: Why do the two numbers get mixed up?
A: Because tools, books, and teams define the start and stop points differently. Jira, Kanban, DORA, and manufacturing each use their own. The numbers can differ by weeks for the same piece of work. Write your definitions down once and apply them to every team.
Q: Can a team have a great cycle time and a terrible lead time?
A: Yes, and it is common. Engineers finish work in three days, but the request waited a month for prioritization. Cycle time says the team is fast. Lead time says customers wait. Both are true, and they point at different owners.
What Is the Difference Between Cycle Time and Lead Time?
Lead time is the total elapsed time from a request to delivery, and cycle time is the elapsed time from the start of active work to completion. The two metrics describe the same piece of work from different positions on the timeline. Lead time is the customer's view: I asked on the 1st, I got it on the 25th, so I waited 24 days. Cycle time is the team's view: we picked it up on the 20th and finished on the 24th, so the work took four days. The gap between them is queue time, the days the request sat in a backlog, waiting for prioritization, or waiting for a free engineer. That gap is where most delays hide. It is also where engineering teams have the least control, because it depends on how the company decides what to build next. So the metrics are not rivals. They answer different questions and they usually belong to different people.
| Lead time | Cycle time | |
|---|---|---|
| Clock starts | Request or ticket created | Work actually started |
| Clock stops | Delivered to the user | Work done (merged or deployed) |
| Whose view | The customer's | The team's |
| What it shows | How long people wait | How long work takes once started |
| Who can move it | Product, leadership, and engineering | Mostly the engineering team |
How Do You Calculate Each One? A Worked Example
To calculate either metric, subtract the start timestamp from the end timestamp for each item, then take the median across items. Here is a made-up ticket to show the arithmetic. A customer request is logged on March 1. Product prioritizes it on March 12. An engineer starts it on March 18. The pull request opens on March 20, gets its first review on March 22, merges on March 24, and ships to production on March 25. Lead time is March 1 to March 25, so 24 days. Cycle time, counting from work started to merged, is March 18 to March 24, so 6 days. Of those 24 days, 17 passed before anyone wrote code. This is a hypothetical ticket, but the shape is common: the coding was never the long part. The waiting was. If you only tracked cycle time here, you would congratulate yourselves on a 6-day turnaround while the customer waited most of a month.
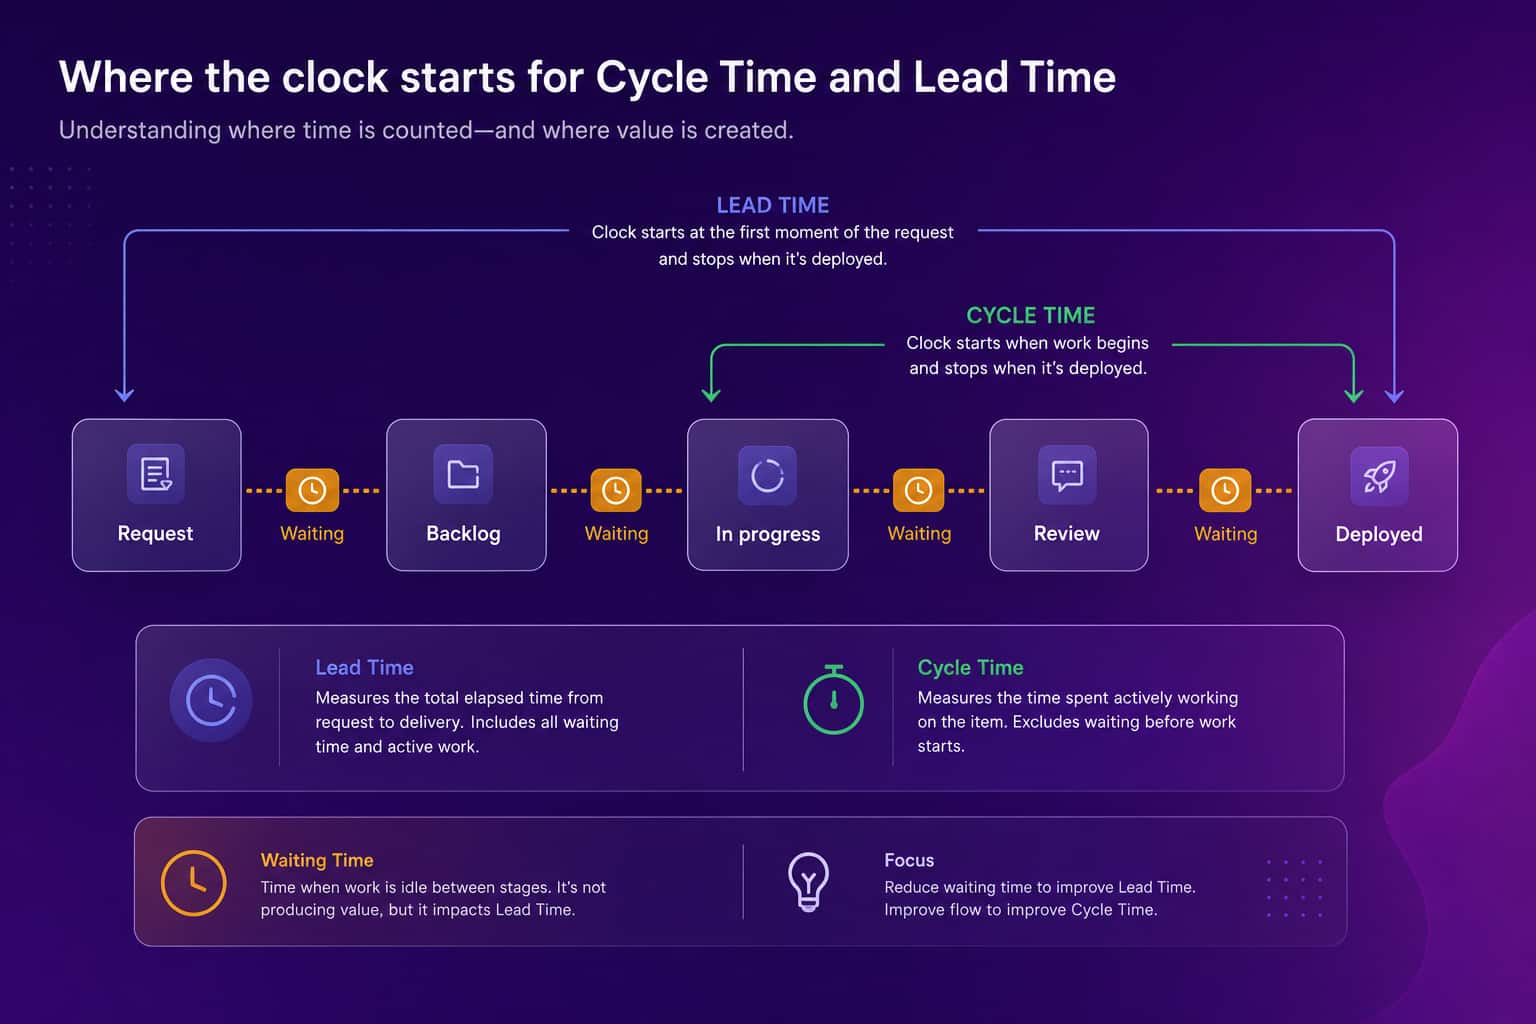
A few measurement choices will change your numbers more than any process improvement. Decide them up front.
- Use the median, not the mean, since one stuck ticket can drag an average for a whole quarter
- Pick one start event for cycle time (first commit, PR opened, or ticket moved to In Progress) and keep it
- Pick one stop event (merged or deployed) and keep it
- Exclude items that were abandoned or reopened, or count them separately
- Report the slowest 10% next to the median so the long tail stays visible
How Does DORA Define Lead Time for Changes?
DORA defines lead time for changes as the time from a code commit to that code running in production, which is narrower than the product-management meaning of lead time. This is the single biggest source of confusion when engineering and product leaders compare notes. A product leader hears "lead time" and thinks request to delivery. An engineering leader reading DORA hears commit to deploy. Both are valid, and both are named lead time, and they can differ by weeks. If your board deck says lead time is 2 days and your product team says customers wait 3 weeks, they may both be right. The DORA version measures your delivery pipeline: how fast does a finished change get out the door. The product version measures your whole system, including the decision to build it. Abloomify computes the DORA version straight from GitHub, banded Elite, High, Medium, or Low, and our guide to DORA metrics walks through all four.
Which Should You Track First?
Track cycle time first, then add lead time. Cycle time is cheaper to measure because the data already exists in GitHub: when the PR opened, when it got its first review, when it merged. It is also the number your team can move without asking anyone else for permission. Lead time needs a reliable request timestamp, which means ticket hygiene across Jira or Linear, and many teams do not have that yet. I would not wait for perfect ticket data before starting, though. Start with cycle time on pull requests, watch it for a month, and you will learn more than a planning meeting would teach you. Then pull in lead time and look at the gap between the two. If the gap is large, your bottleneck is upstream of engineering and no amount of code review tuning will fix it. If the gap is small, the pipeline itself is where the days go. Our piece on engineering KPIs covers what else belongs on that first dashboard.
Where Does the Time Actually Go?
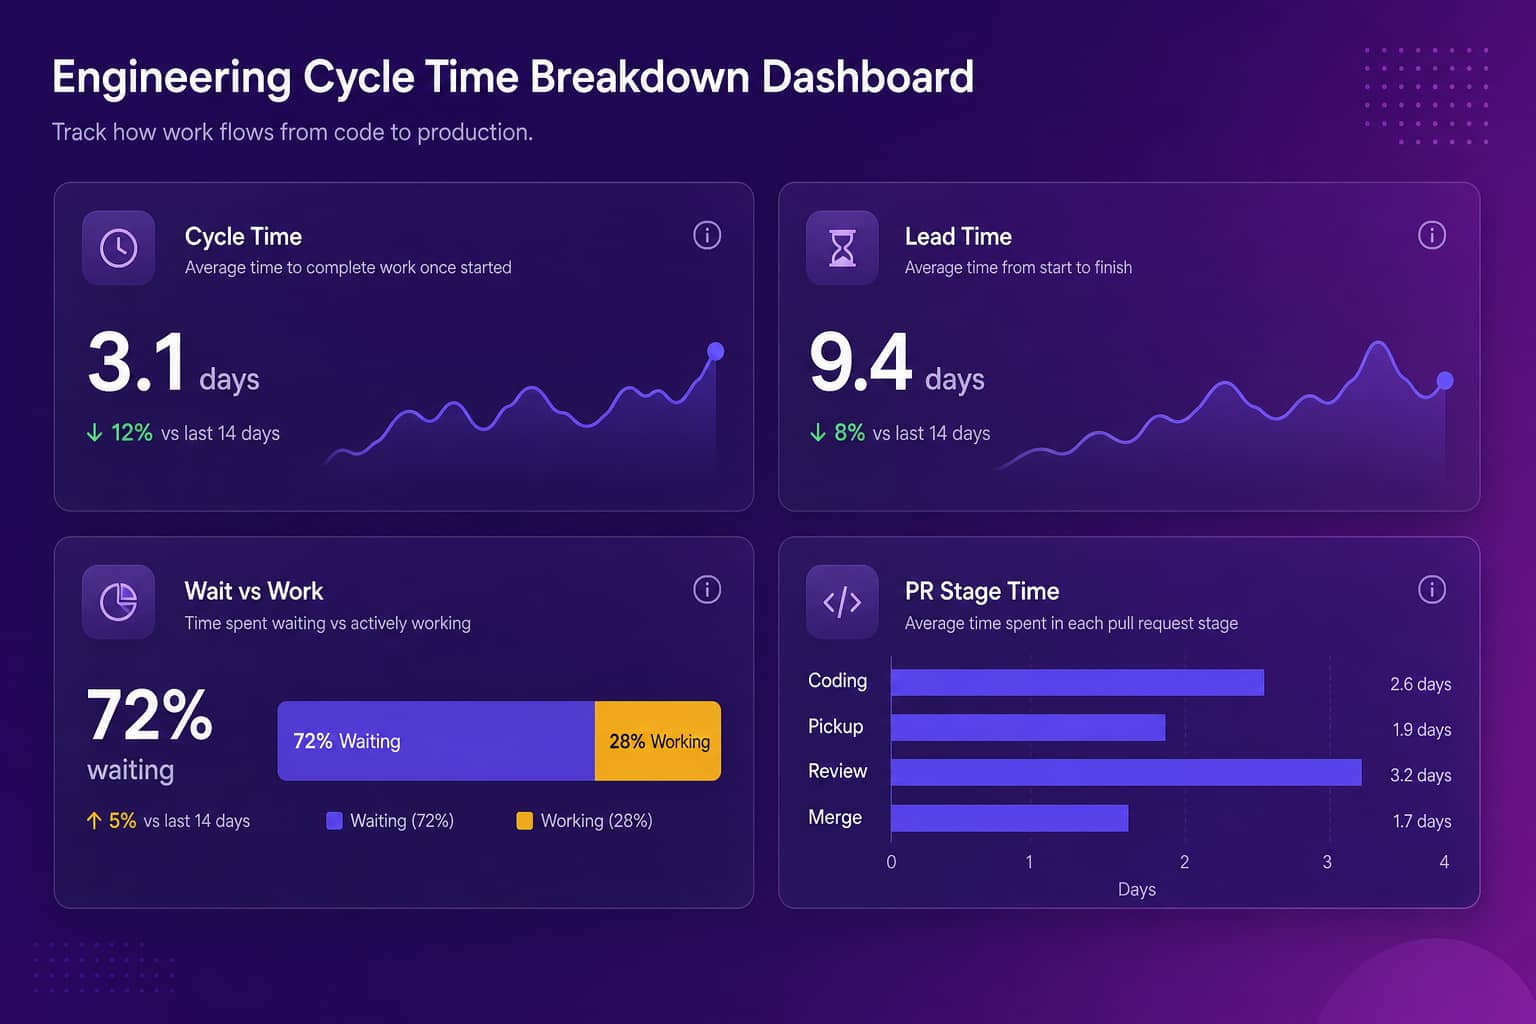
Most of cycle time is waiting, not working: a pull request sits unreviewed, a reviewer asks for changes, the author is in another meeting, the pipeline fails on a flaky test. Break cycle time into stages and the picture gets clear fast. Coding time is how long the author works before opening a PR. Pickup time is how long the PR waits for a first reviewer. Review time is how long feedback goes back and forth. Merge-to-deploy time is how long a merged change waits for release. Pickup time is the stage that usually goes unmeasured while everybody feels it. Abloomify reports PR cycle time, time to first review, review health, self-merge rate, and PR size from the same GitHub integration, so you can see which stage is eating the days for each team. The usual lever is smaller PRs. Our walkthrough on reducing code review cycle time covers the tactics that work.
What About AI Coding Tools?
AI coding tools tend to shrink coding time and leave waiting time alone, which means cycle time can look better while lead time barely moves. I moved our stack from GitHub Copilot and ChatGPT to Cursor about a year ago and the writing of code got much faster. Review did not. More code arrives for the same number of reviewers, so pickup and review time can grow even as coding time falls. That is a pattern worth checking on your own team instead of assuming. Abloomify separates human and AI-agent contribution across tasks, code, PRs, and reviews, and correlates Cursor, Claude Code, and GitHub Copilot usage with engineering output. So the question changes from "is AI making us faster" to "which stage got faster, and which got slower." It does this through API integrations and aggregated signals, privacy-first, with no screenshots and no reading of your code content.
FAQ
What is the difference between cycle time and lead time?
Lead time starts when someone asks for the work and ends when it is delivered. Cycle time starts when someone begins working on it and ends when it is done. Lead time is what the customer feels. Cycle time is what the team controls. Lead time is always equal to or longer than cycle time.
Is lead time always longer than cycle time?
Yes, for the same piece of work. Lead time contains the cycle time plus the waiting before work starts. If a request sits in the backlog for three weeks and the team finishes it in four days, lead time is about 25 days and cycle time is 4. A team with no backlog queue has near-equal numbers.
How does DORA define lead time?
DORA measures lead time for changes: the time from a code commit to that code running in production. That is narrower than the product definition, which starts at the customer request. Abloomify computes DORA lead time straight from GitHub and bands it Elite, High, Medium, or Low.
Should I track cycle time or lead time first?
Start with cycle time, because the team can change it and the data already sits in your repos. Add lead time once you want to see how long ideas wait before anyone touches them. If you only report one number to the board, lead time is the one customers actually experience.
What is a good cycle time for a software team?
There is no universal number, and anyone who gives you one is guessing. Compare your team to its own trend. A team that moves median PR cycle time from five days to two has improved a lot, whatever the industry average says. Track the median and the slowest 10%, not only the mean.

Amir Tavafi
Co-Founder & CEO
Product leader and innovator with over 15 years of experience in the tech sector, grounded in AI and robotics. Previously led product development in fraud detection and AI solutions at Nasdaq Verafin.