Engineering KPIs That Predict Delivery (Not Vanity Metrics)
July 29, 2026
Amir Tavafi
11 min read

Engineering KPIs should change a decision. Most do not. They fill a dashboard nobody acts on: commit counts, lines of code, story points stacked into a slide for the board. The engineering KPIs that matter tell a VP of Engineering where work is stuck and whether the team is shipping faster than last quarter. Abloomify reads those signals from GitHub, Jira, and Linear without touching a line of code content.
Key Takeaways
Q: What are engineering KPIs?
A: Engineering KPIs are quantitative signals about how software work flows from a first commit to running code, and whether it stays healthy once it ships. The useful ones live at the team level: PR cycle time, deployment frequency, change failure rate, and review health.
Q: Which engineering KPIs actually matter?
A: The ones that connect to delivery outcomes you can influence this sprint. PR cycle time, deployment frequency, change failure rate, review wait time, and workload balance. Each one, when it moves, tells a leader to do something differently. If nothing changes, it is decoration.
Q: What engineering KPIs should you stop reporting?
A: Lines of code, commit counts, story points compared across teams, and hours logged. They are trivial to count and trivial to game. Lines of code punish the engineer who deletes 400 lines of dead code and reward the one who pads a feature.
Q: How do AI coding tools change engineering KPIs?
A: They add a new question: how much of the output is human and how much is the agent? Abloomify separates human from AI agent contribution across tasks, code, and reviews, then correlates Cursor, Claude Code, and Copilot usage with delivery to show real ROI.
Q: Can you track engineering KPIs without surveillance?
A: Yes. Abloomify uses API connections and PII-free signals, so there are no screenshots, no keyloggers, and no screen recording. You measure how work moves through GitHub and Jira, not what an engineer typed or read.
What are engineering KPIs?
Engineering KPIs are quantitative signals that describe how software work moves from a first commit to running code in production, and whether that code holds up once it gets there. Good ones answer questions a VP of Engineering actually asks on a Monday: where are PRs stuck, is the team shipping faster or slower than last quarter, is review load fair, and did last week's deploys break anything. They live at the team level, because individual scorecards turn into surveillance and gaming almost immediately. They draw on data engineers already generate in GitHub, Jira, and Linear, so collecting them costs no extra effort. The test for any engineering KPI is simple. If the number moves and nobody does anything differently, it was never a KPI. It was a chart.
The engineering KPIs that predict delivery
The engineering KPIs that predict delivery share one trait: they connect to outcomes a leader can influence this sprint. PR cycle time, the span from first commit to merge, is the single best proxy for delivery speed, and a median above 48 hours almost always points to a review bottleneck rather than slow coding. Deployment frequency shows how often value actually reaches users. Review wait time exposes where cycle time leaks, usually in the hours a PR sits unclaimed. Workload balance tells you whether one or two people are carrying the team while others coast. Track these as trends at the team level, never as a leaderboard. A leaderboard turns a useful signal into a game people learn to win without shipping anything.
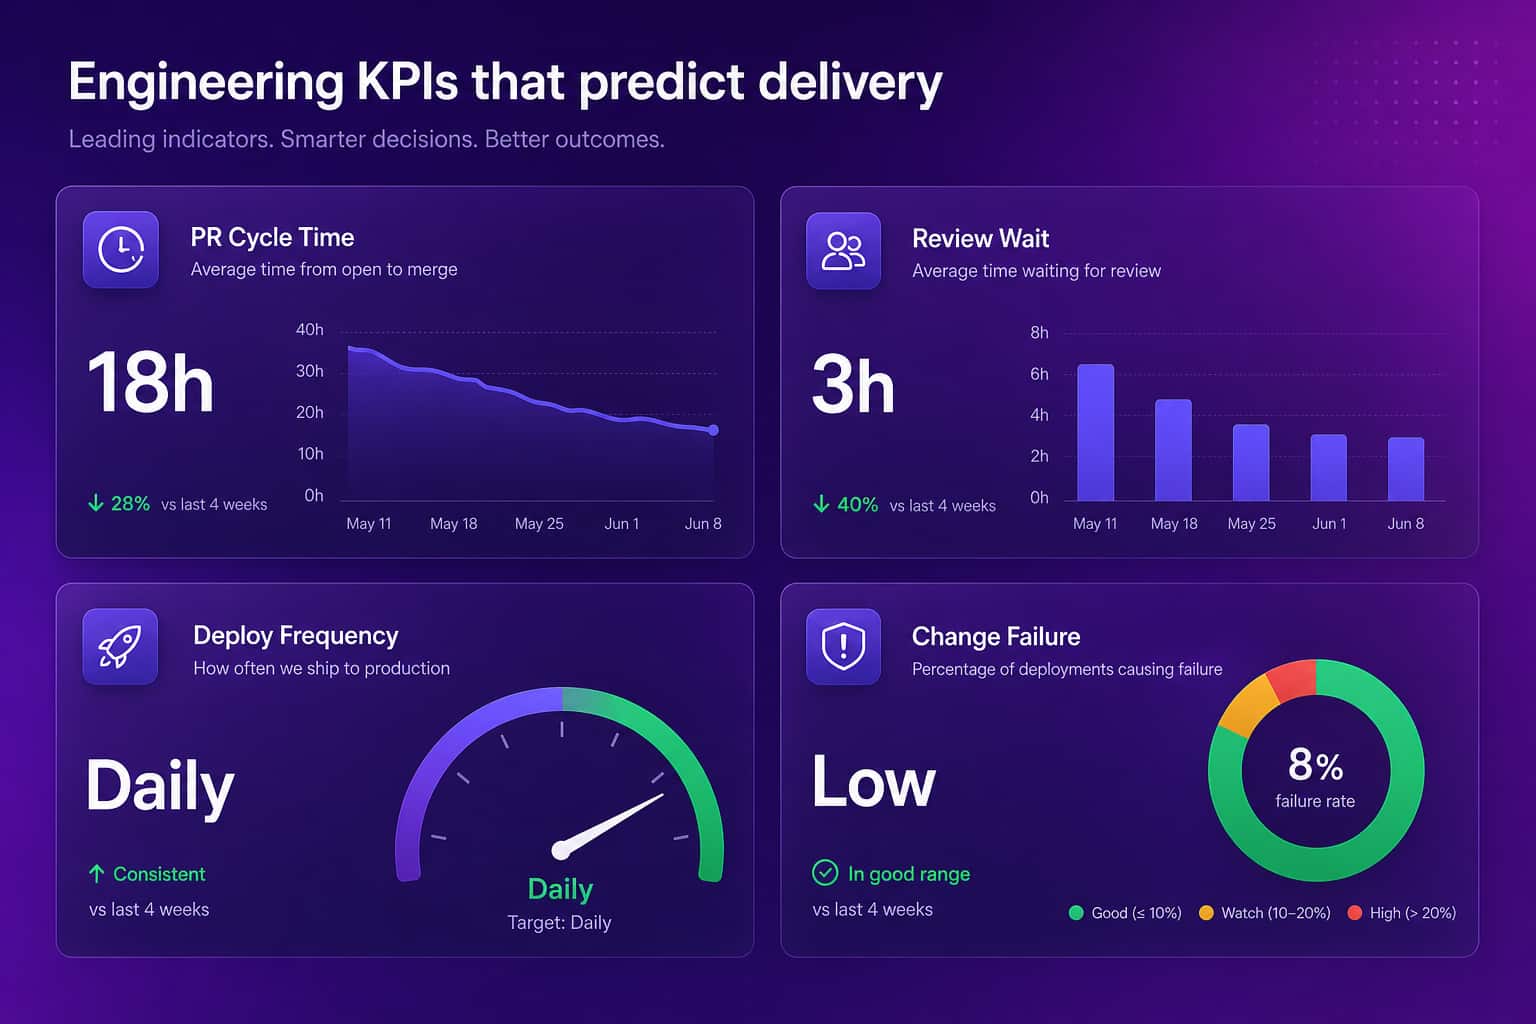
Here is the short version of what to watch and the healthy direction for each.
| Engineering KPI | What it tells you | Healthy direction |
|---|---|---|
| PR cycle time | Delivery speed end to end | Median under 24 hours |
| Review wait time | Where cycle time leaks | First review under 4 hours |
| Deployment frequency | How often value ships | Trending up or steady |
| Change failure rate | Whether speed stays safe | Low and stable |
| Workload balance | Whether load is fair | No single point of failure |
Several of these map to the four DORA delivery metrics, which are the closest thing engineering has to a shared benchmark. The rest come from the daily reality of how review and meeting load shape what a team can actually finish. For a metric-by-metric breakdown of the delivery side, our guide to engineering velocity metrics for VPs goes deeper.
Quality and reliability KPIs that keep speed honest
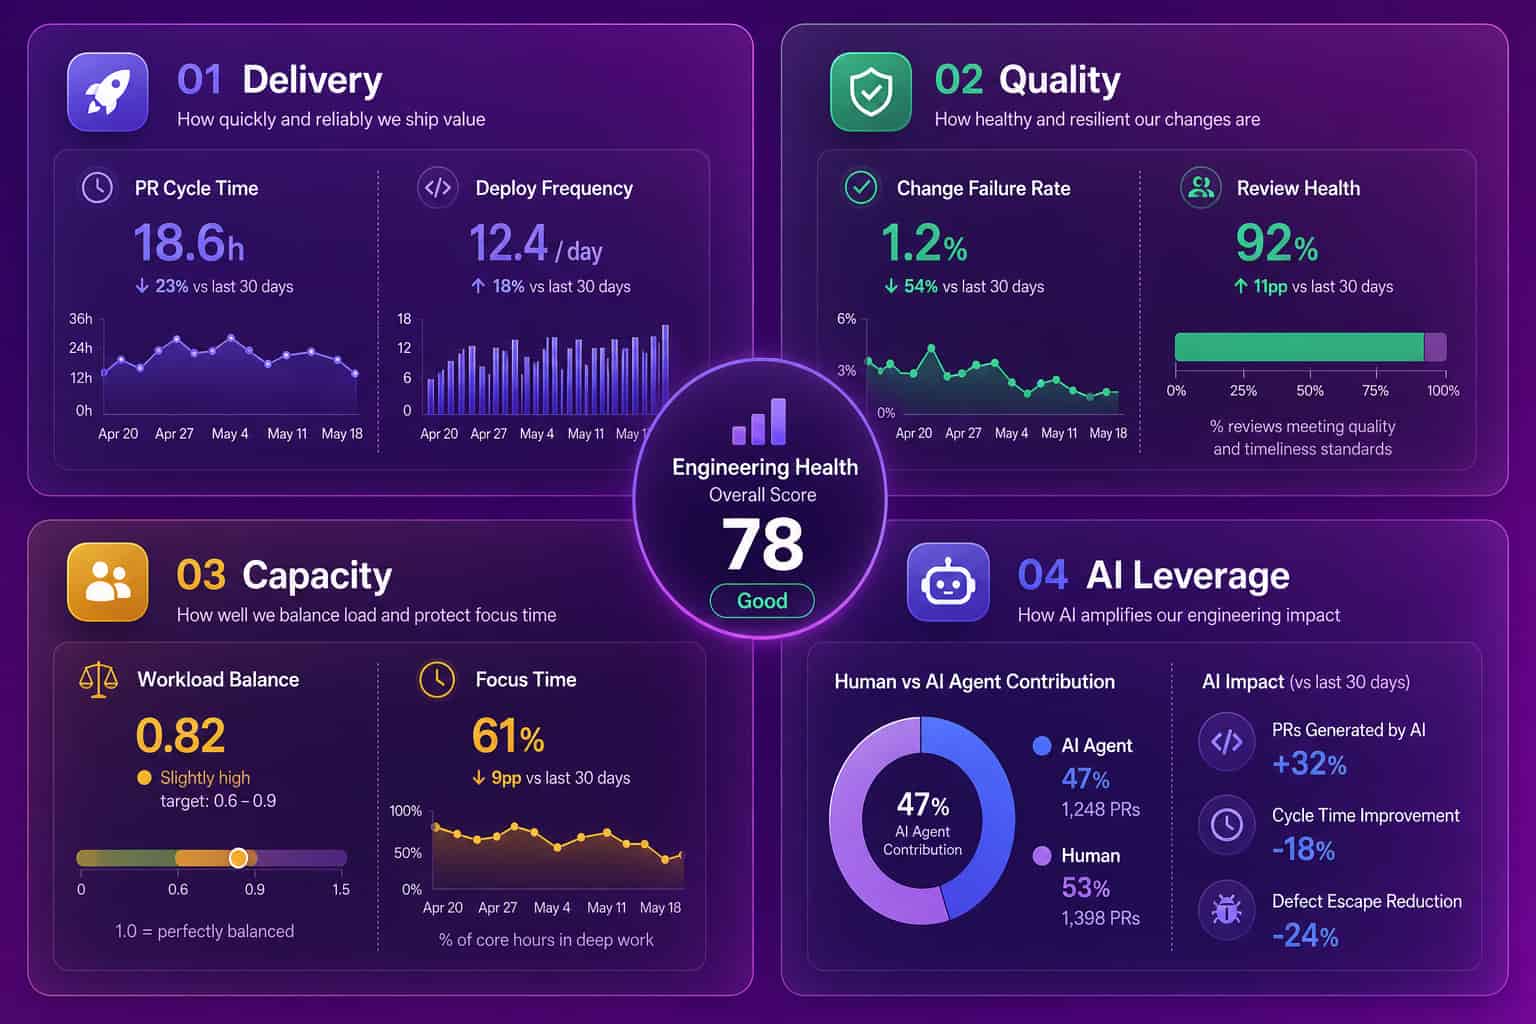
Quality KPIs exist to stop the team from confusing motion with progress. Shipping fast and breaking often is not velocity, it is rework with a nicer chart. Change failure rate, the share of deploys that cause an incident or need a fix, is the single number that keeps delivery speed honest. Time to restore service tells you how quickly the team recovers when something does break, which matters more than pretending nothing ever will. Review health, meaning how thoroughly and how quickly PRs get looked at, is where quality is actually decided, long before anything reaches production. A team can drive PR cycle time down by rubber-stamping reviews, and the quality KPIs are what catch that trade before customers do. Watch delivery and quality together, or you optimize one at the expense of the other.
The AI-era engineering KPI: human vs AI agent contribution
The newest engineering KPI answers a question that did not exist three years ago: how much of this output is human, and how much is the agent? "The team shipped 30 PRs" no longer means what it used to when a coding agent drafted a third of them. Abloomify separates human from AI agent contribution across tasks, code, and reviews, then correlates usage of Cursor, Claude Code, and GitHub Copilot with engineering output. That split is the foundation of honest AI tool ROI: not how many seats you bought, but whether the usage translates into faster, safer delivery. It also guards against the comfortable illusion that more AI-generated code automatically means more value, when sometimes it just means more code to review.
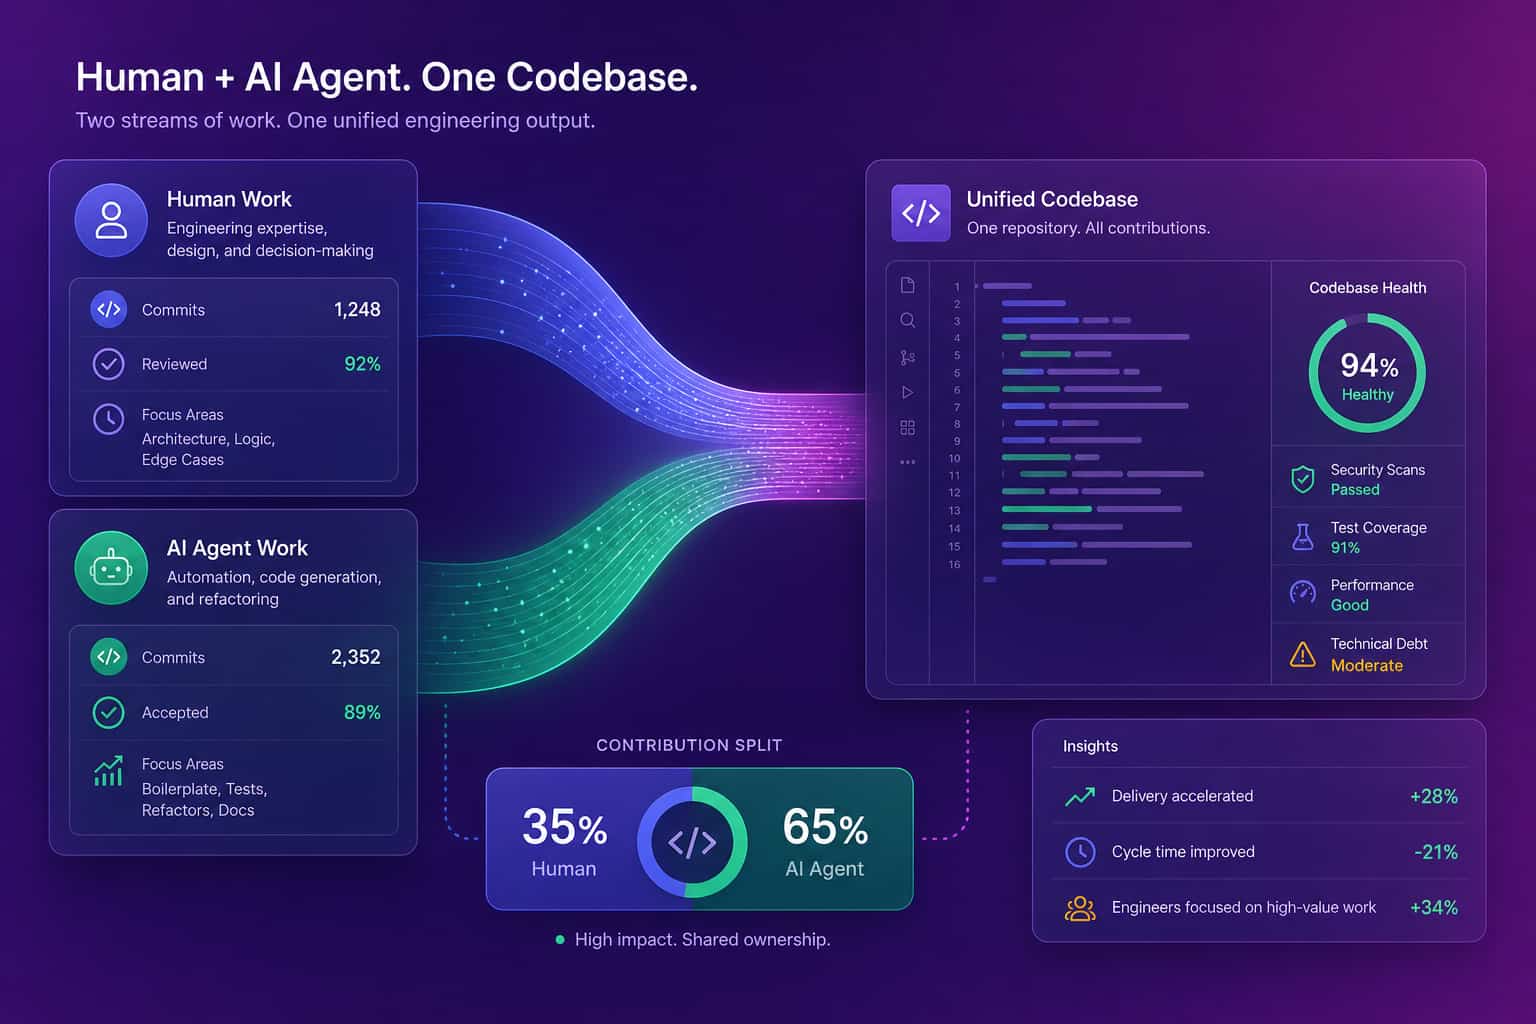
A quick warning from experience. Large language models are very good at making you feel confident about a decision you have not actually checked. AI coding tools are no different. A team can swear Copilot made them faster while the delivery data shows review queues swelling under the extra volume. The only way to know is to measure usage against output, per team, over time. The tools are genuinely strong. The way to prove it is data, not vibes.
Capacity and business-impact KPIs leaders actually ask about
Capacity and business-impact KPIs are the ones a COO or CFO raises when the board asks what engineering is returning on payroll. Delivery metrics tell you how fast the team ships. Capacity metrics tell you whether the team even has room to ship, or whether meeting overload and uneven workload are quietly eating the week. Unseen capacity waste costs a growing organization an estimated $500K to $2M a year, and none of it shows up in a Jira report. This is also where a lot of a leader's own week disappears: chasing status updates, copy-pasting metrics into decks, digging across five tools to answer a basic question like who is overloaded right now. The right KPIs kill that busywork instead of adding another dashboard to check.
Engineering KPIs to stop reporting
The engineering KPIs worth dropping are the ones that are easiest to count and feel objective: lines of code, commit count, story points compared across teams, and hours logged. They survive in dashboards because they are convenient, not because they predict anything. Lines of code reward padding and punish the engineer who deletes dead code. Commit counts reward many tiny commits over one clean change. Story points only carry meaning inside a single team over time, so comparing them across teams produces confident nonsense. Hours logged measure presence, which has almost nothing to do with output in knowledge work. The damage runs deeper than inaccuracy. When you measure activity, people optimize for activity, and you get busier teams that ship less.
Drop these as engineering KPIs:
- Lines of code: gameable, and it penalizes clean, concise work.
- Commit count: rewards noise over meaningful change.
- Story points across teams: only comparable within one team over time.
- Hours worked or logged in: measures presence, not delivery.
Vanity metrics are comforting because they always go up. A KPI that can only rise is not measuring anything real. If a number would embarrass no one no matter how the team behaved, it is not a KPI worth a leadership slide. For the measurement side of this in more depth, our breakdown of developer productivity metrics separates the signals from the noise.
How to track engineering KPIs without surveillance
You track engineering KPIs without surveillance by reading work signals through APIs instead of watching screens. Abloomify connects to GitHub, Jira, Linear, and AI coding tools and analyzes how work moves: PR timing, review patterns, deployment cadence, workload balance, and contribution mix. It never reads code content, takes screenshots, logs keystrokes, or records screens. That distinction is not cosmetic. Screen-monitoring tools generate real resistance, and engineers game or resent them, while signal-based analytics measure the actual flow of delivery from systems teams already use. Privacy-first is the lead, and PII-free architecture is how it is delivered: signals about work, never content about people. The result is a fair picture engineers can look at without feeling watched, which is the only kind of KPI a team will trust enough to improve against.
Good KPIs survive scrutiny from the people they describe. Bad ones get gamed. If your engineers would be uncomfortable seeing how a number is collected, it is the wrong number. You can see the same signals across delivery, review health, and workload in our engineering productivity analytics, built for engineering leaders who want clarity without a monitoring agent on every laptop. Pick the five KPIs that would actually change a decision this quarter. Drop the rest.
FAQ
What are the best engineering KPIs to track?
The most useful engineering KPIs are delivery-oriented and team-level: PR cycle time, deployment frequency, change failure rate, review wait time, and workload balance. Each ties to a decision a leader can act on. Abloomify reads them from GitHub, Jira, and Linear without reading code content or installing screen monitoring.
Are lines of code a good engineering KPI?
No. Lines of code, commit counts, and hours logged measure activity, not delivery. They are easy to game and they punish clean, concise work. An engineer who deletes 400 lines of dead code looks unproductive on these metrics while making the system healthier. Measure how work flows, not how much gets typed.
How many engineering KPIs should a team track?
Fewer than most dashboards show. Five that would each change a decision beat twenty that fill a slide. A practical set covers delivery (PR cycle time, deployment frequency), quality (change failure rate, review health), and capacity or AI leverage. If a metric never triggers an action, drop it.
How do DORA metrics fit into engineering KPIs?
DORA gives you four delivery KPIs with shared benchmarks: deployment frequency, lead time for changes, change failure rate, and time to restore service. They answer how fast and how safely a team ships. They are a strong core, but pair them with capacity and human vs AI contribution signals so you see the full picture, not just delivery speed.
How do you measure the ROI of AI coding tools?
Tie usage to output. Abloomify imports usage signals from Cursor, Claude Code, and GitHub Copilot, then correlates them with engineering output such as PR cycle time and code velocity. It separates human from AI agent contribution, so you can see whether the spend produces faster, safer delivery instead of just more code to review.

Amir Tavafi
Co-Founder & CEO
Product leader and innovator with over 15 years of experience in the tech sector, grounded in AI and robotics. Previously led product development in fraud detection and AI solutions at Nasdaq Verafin.