Flow Metrics: How to Measure Engineering Flow in 2026
July 3, 2026
Amir Tavafi
12 min read

Flow metrics measure how work moves through your engineering value stream, from the moment a piece of work is accepted to the moment it ships. The idea comes from the Flow Framework, and it exists because deployment counts and story points tell you how busy a team looks, not whether value is actually flowing. Abloomify tracks flow signals like PR cycle time and work in progress from the tools your team already uses, with no screenshots, no keyloggers, and no surveillance.
Key Takeaways
Q: What are flow metrics in software engineering?
A: Flow metrics track how units of business value move through a value stream. The five are flow velocity, flow time, flow efficiency, flow load, and flow distribution. They come from Dr. Mik Kersten's Flow Framework and focus on the flow of value, not the volume of activity.
Q: What is flow efficiency and why does it matter?
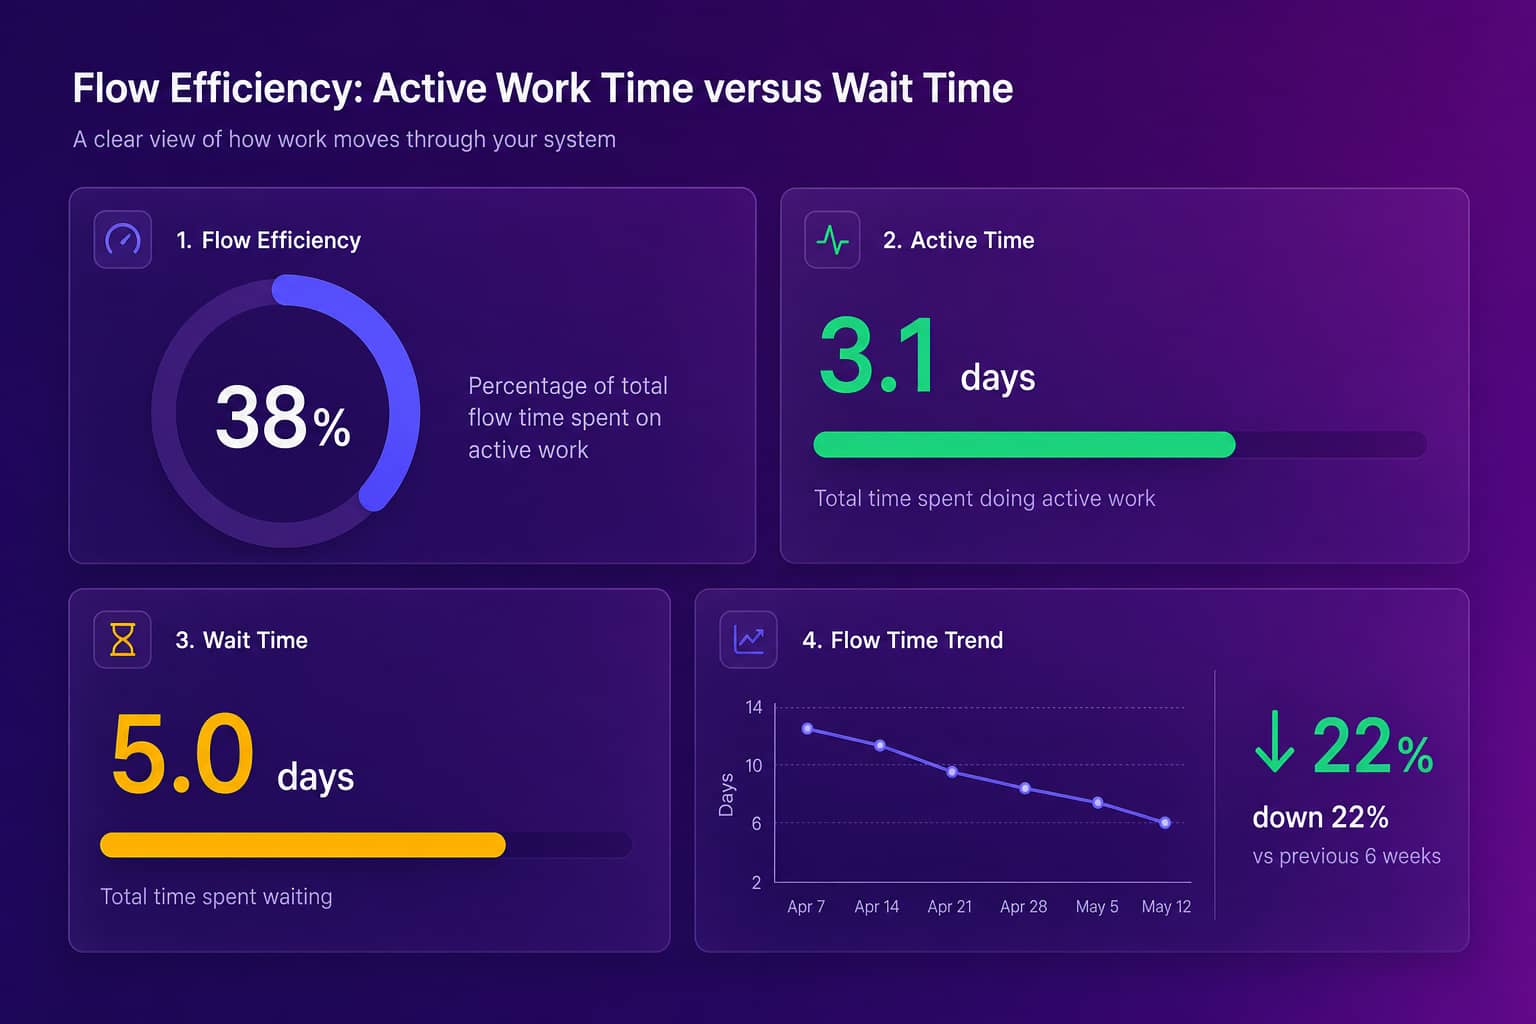
A: Flow efficiency is the share of total flow time that work spends being actively worked on, versus waiting in a queue. Many teams find it sits between 15 and 40 percent. A low number means your problem is waiting, not working, which changes what you fix first.
Q: How are flow metrics different from DORA?
A: DORA measures delivery pipeline health with four metrics. Flow metrics measure the wider journey of work, including the wait time before code ever reaches the pipeline. Abloomify computes both, placing DORA metrics next to flow time and flow load so delivery and flow sit on one screen.
Q: Can flow metrics be tracked without surveillance?
A: Yes. Abloomify reads flow signals from GitHub, Jira, and Linear through API, PII-free by architecture. There are no screenshots or keyloggers, and results are aggregated at the team level. Flow time and flow load come from timestamps that already live in your tools.
What are flow metrics?
Flow metrics are a set of five measures that track how business value moves through a value stream, introduced by Dr. Mik Kersten in his 2018 book Project to Product and the Flow Framework it defines, and they exist because most engineering dashboards count outputs (commits, story points, deploys) without ever showing whether work is actually moving or sitting still in a queue. The unit of measurement is the flow item, which is any piece of business value moving through your system: a feature, a defect, a risk item, or a chunk of technical debt. Instead of asking how many things a team produced, flow metrics ask how long value takes to travel end to end, how much of that time is real work versus waiting, how much is in progress at once, and what mix of work the team is actually doing. That reframing matters because a team can raise its output every sprint while flow time gets worse, which means customers wait longer even as the activity charts go up.
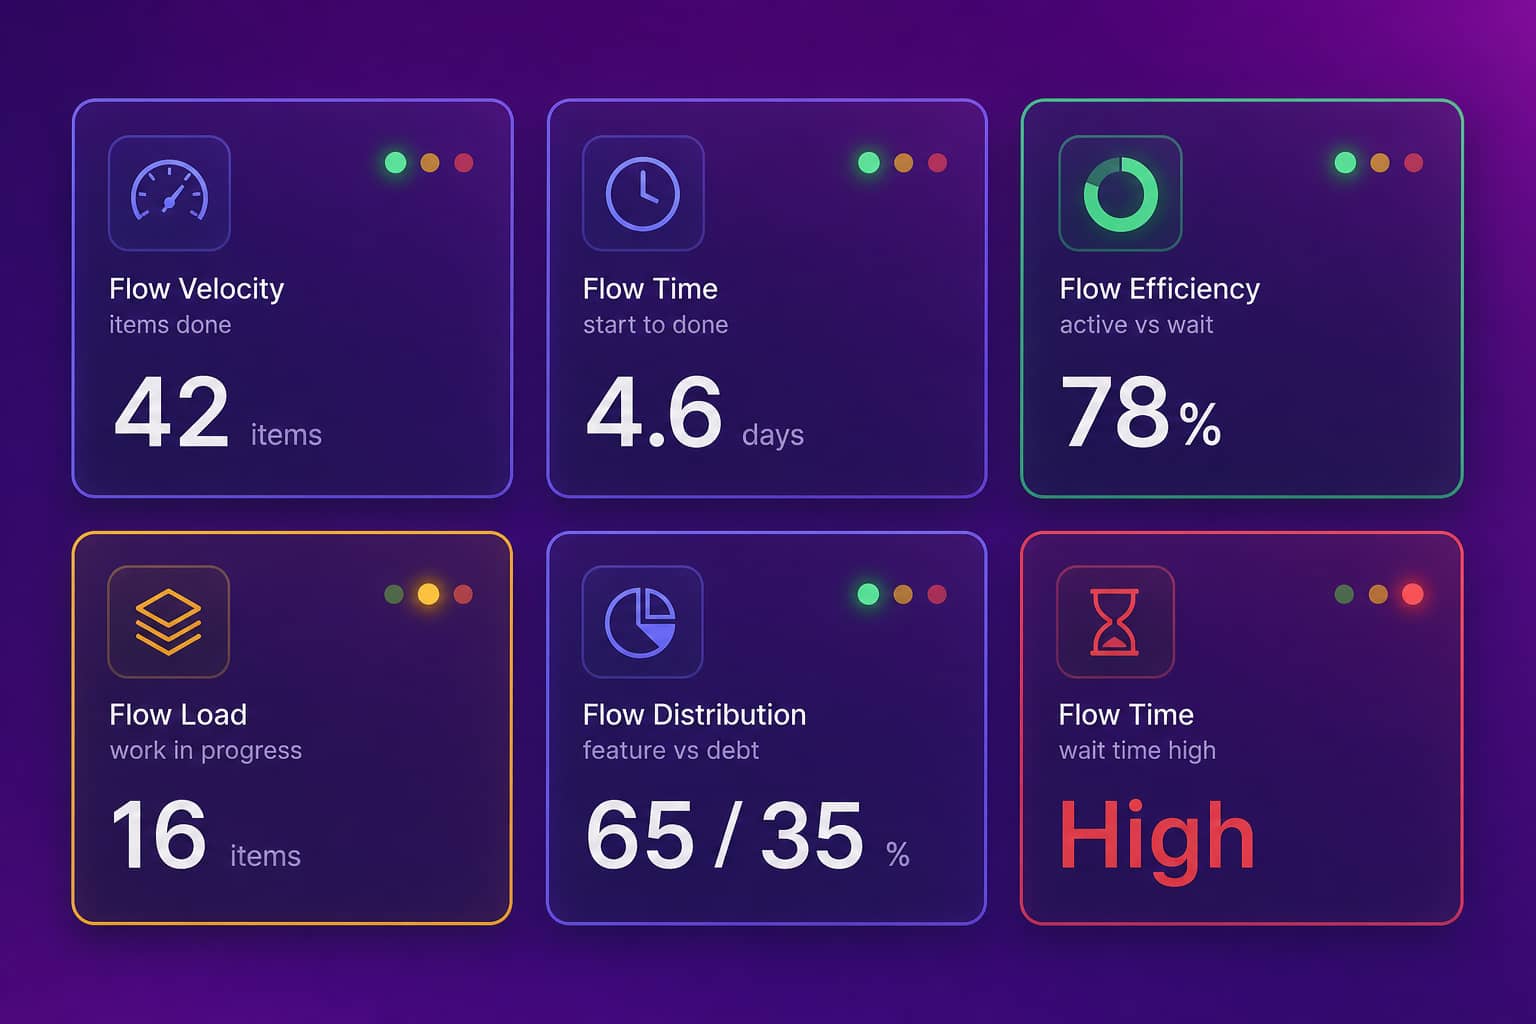
The five flow metrics work as a set. Read one alone and you get the same distortion that lines of code or velocity points create. Here is what each one measures.
| Flow metric | What it measures | Watch for |
|---|---|---|
| Flow Velocity | Flow items completed in a period (throughput) | Rising velocity with rising flow time |
| Flow Time | Elapsed time from work accepted to work done | Long tails hidden behind a healthy average |
| Flow Efficiency | Active work time as a share of total flow time | Efficiency under 40 percent means queues rule |
| Flow Load | Flow items in progress at once (WIP) | Load climbing faster than velocity |
| Flow Distribution | The mix of features, defects, risks, and debt | Zero debt or zero risk work for months |
The five flow metrics, explained
Each flow metric answers a different question, and the framework only works when you read them together rather than picking a favorite. Flow velocity counts how many flow items a team finishes in a period, which is useful as a throughput trend but dangerous alone because it says nothing about whether those items took a day or a month. Flow time measures the full elapsed time from when work is accepted to when it is done, wait time included, and it is usually the metric that surprises leaders most. Flow efficiency divides active time by total flow time, exposing how much of a work item's life is spent sitting in a queue waiting for a review, a decision, or a dependency. Flow load counts how many items are open at once, and it is the lever teams pull wrong most often, piling on more work in progress and wondering why flow time gets worse. Flow distribution shows the mix of work: features, defects, risk, and debt.
Flow efficiency is the one worth staring at. When a team measures it for the first time, the number is often uncomfortable, sitting somewhere between 15 and 40 percent, which means a work item spends most of its life waiting rather than being worked on. That is not a motivation problem you can monitor your way out of. It is a queue problem, a handoff problem, or a review-latency problem, and the fix is structural. This is where flow metrics get practical fast, because cutting wait time is usually cheaper than trying to squeeze more hours out of people.
Flow metrics vs DORA and SPACE: which do you need?
You need more than one, because flow metrics, DORA, and SPACE answer different questions about the same engineering system. DORA measures software delivery performance through four metrics (deployment frequency, lead time for changes, change failure rate, and time to restore service) and is the sharpest tool for the health of your deployment pipeline. Flow metrics zoom out past the pipeline to the whole value stream, capturing the wait time that piles up before code is ever written and the work mix that DORA never sees. SPACE goes wider still, adding the human dimensions of satisfaction and collaboration. A useful way to hold them: DORA tells you the pipeline is slow, flow metrics tell you work waited nine days in a queue before it reached the pipeline, and SPACE tells you the engineer who owns it is close to burning out. Pick DORA if your question is delivery reliability. Add flow metrics when your question is where work stalls. Layer SPACE when you need the human system behind both.
Abloomify does not make you stitch three tools together to get this view. It scores the four DORA metrics with performance bands, tracks flow signals like PR cycle time and work in progress, and reads the SPACE dimensions from the same connected data. For the delivery-focused version of this cut, our guide to engineering velocity metrics shows how the pieces map to a single Engineering Velocity Score.
How to measure flow metrics without surveilling engineers
The fastest way to break a flow-metrics program is to collect it with surveillance, and it is completely unnecessary. Flow time, flow load, and flow efficiency all come from timestamps that already exist in GitHub, Jira, and Linear: when an item was accepted, when it moved columns, when the PR opened, when review started, when it merged. You do not need a screenshot or a keylogger to compute any of that. Abloomify connects to those systems through 100+ API integrations and reads signals only, never code content, message content, or file content. That matters for adoption, because 1 in 6 workers say they would quit over surveillance, and the Personnel Psychology meta-analysis found no evidence that monitoring improves performance. A flow program built on monitored screens poisons the trust it needs to get honest data.
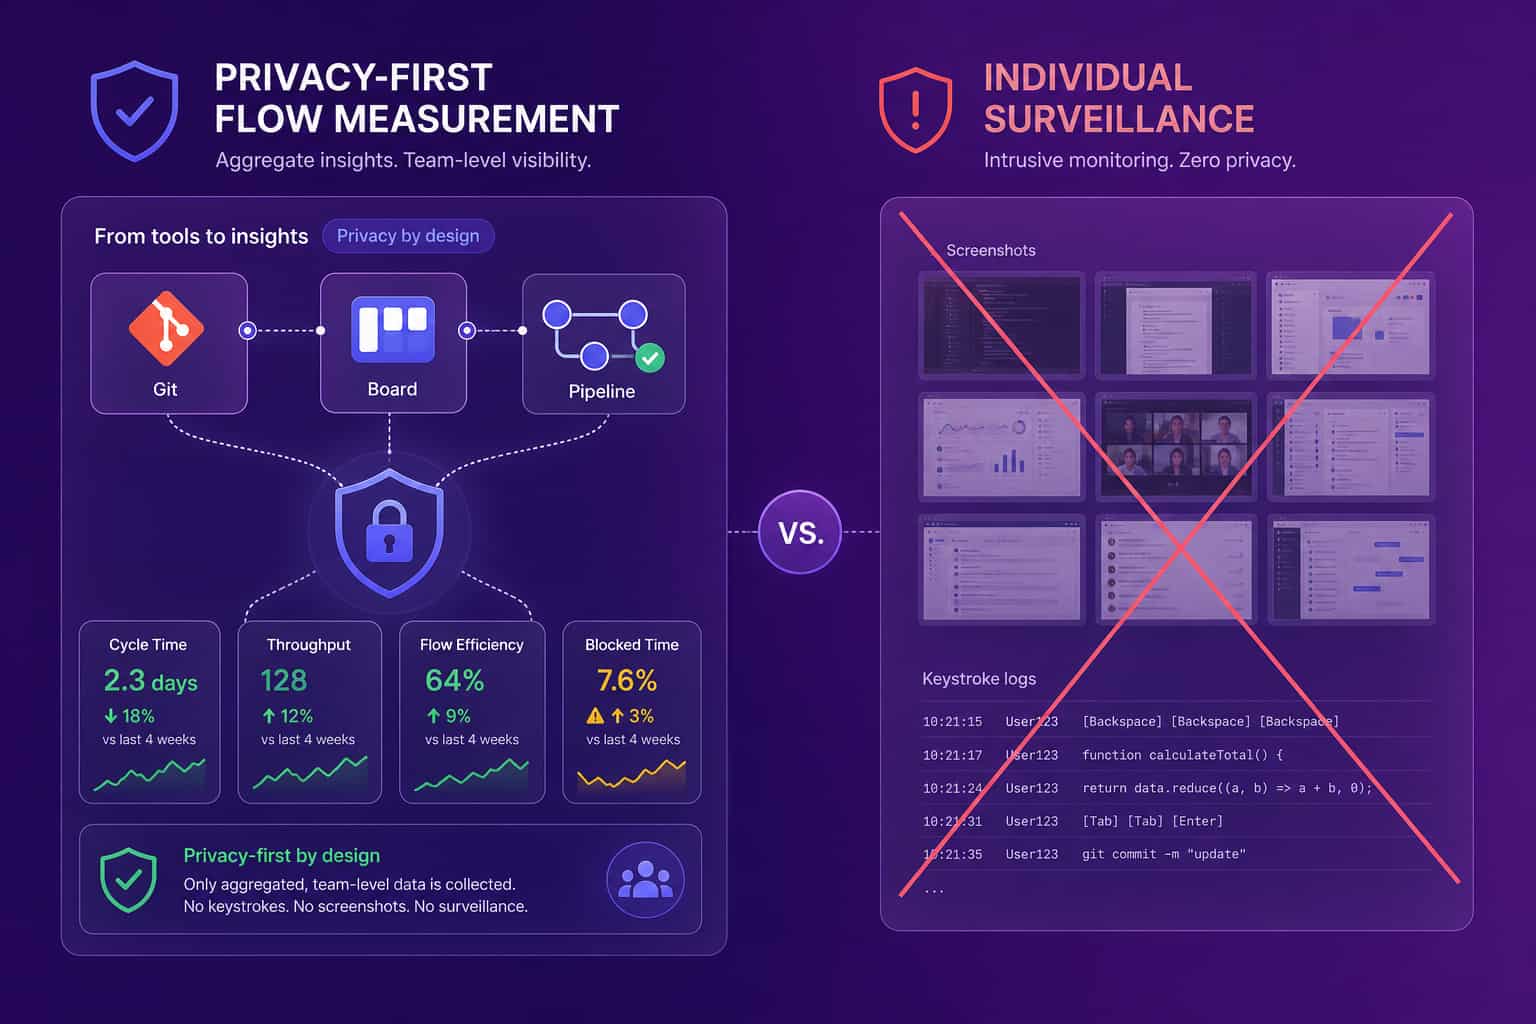
Privacy-first measurement is also better measurement. When engineers know flow metrics are aggregated at the team level and cannot be turned into a personal leaderboard, they stop gaming the board and start using the data to argue for fixing the queue. Abloomify is PII-free by architecture and reports flow signals at the team and cohort level by default. For the fuller argument, see how to measure productivity without screenshots. The point of flow metrics is to find where work waits, and you cannot find that if the measurement itself makes people hide.
What flow metrics miss when AI writes the code
By 2026, flow velocity has a new blind spot, because a growing share of the work items and code changes moving through your value stream are no longer produced by humans. When Cursor, Copilot, or Claude Code generate code, raw throughput and change volume climb without proving that flow time improved or that customers got value faster. We saw this inside Abloomify. After we leaned into AI coding tools, our output jumped, and the honest way to know whether it helped was to look at flow time and delivered outcomes rather than trust the volume going up. Counting AI-inflated activity as flow is exactly the distortion the Flow Framework was built to stop, now with a faster engine behind it.
Abloomify separates human, AI agent, and bot contributions across code and reviews, so flow velocity reflects who and what actually moved the work. It also measures AI coding tool adoption and ties usage to output, which turns "we bought Cursor for the whole team" into a real answer about whether heavy adopters ship and review faster. That keeps flow distribution honest too, so a wave of AI-generated churn does not get mistaken for a healthy feature mix. If you are rolling out AI assistants, pair flow metrics with our guide to reducing code review cycle time, because AI tends to move the bottleneck downstream into review.
How to roll out flow metrics on your team
Start with one value stream and one uncomfortable number, then let the fix earn trust before you widen the program. Flow rollouts fail the same way SPACE and DORA rollouts fail, when a leader drops a wall of unfamiliar charts on a team that assumes the numbers will be used against them. The sequence matters more than the tooling. Map a single value stream, connect the systems that already hold its timestamps, measure flow time and flow efficiency first, and make the opening move about killing a queue rather than judging a person. Once the team watches wait time drop because you fixed slow first reviews instead of asking people to work later, expanding to velocity, load, and distribution is easy.
- Pick one value stream. Choose a single team or product line. Flow metrics are meaningless averaged across unrelated work.
- Connect the sources, not the screens. Wire up GitHub, Jira or Linear, and your CI through API. Skip anything that captures screenshots or keystrokes.
- Measure flow time and flow efficiency first. These two expose where work waits, which is almost always the biggest, cheapest win.
- Cut work in progress before adding it. Lower flow load, watch flow time fall, and let the team see the cause and effect.
- Add the AI layer. Once human contribution is measured cleanly, separate AI agent contribution so velocity and distribution stay honest.
When Customer 1, a 50-person Canadian SaaS, first connected their engineering data, their COO checked the numbers against a spreadsheet they had built by hand. The numbers matched. As the COO put it, "what I did manually this week in a spreadsheet is exactly what I think Abloomify should be doing automatically." That is the whole promise of flow metrics. Not a faster stopwatch on people. A shared, trusted picture of where value gets stuck. Fix the queue. Ship the work.
FAQ
What are the five flow metrics?
The five flow metrics are flow velocity, flow time, flow efficiency, flow load, and flow distribution. They come from the Flow Framework introduced by Dr. Mik Kersten in 2018 and measure how business value (features, defects, risks, and debt) moves through a value stream, rather than counting raw outputs like commits or story points.
What is a good flow efficiency score?
There is no universal target, but many teams find their flow efficiency sits between 15 and 40 percent, meaning work spends most of its life waiting in queues. A low number points to handoffs, review latency, and dependencies rather than lazy people. Raising active time as a share of total flow time is usually the fastest improvement available.
What is the difference between flow metrics and DORA metrics?
DORA measures delivery pipeline performance with deployment frequency, lead time, change failure rate, and time to restore. Flow metrics measure the wider value stream, including the wait time before work reaches the pipeline and the mix of work being done. Abloomify computes both so delivery health and flow sit side by side in one view.
Can you track flow metrics without monitoring developers?
Yes. Abloomify derives flow time, flow load, and flow efficiency from the timestamps already in GitHub, Jira, and Linear through API integrations. It is PII-free by architecture, with no screenshots, keyloggers, or code content ingestion, and reports at the team level rather than ranking individuals, which keeps the data honest.
Amir Tavafi
Co-Founder & CEO
Product leader and innovator with over 15 years of experience in the tech sector, grounded in AI and robotics. Previously led product development in fraud detection and AI solutions at Nasdaq Verafin.