The AI Productivity Paradox: Faster Coding, Same Delivery
October 8, 2026
Reza Vatani
11 min read

The AI productivity paradox is what happens when engineers write noticeably more code with AI tools and the company ships at roughly the same pace. Output per developer goes up. Delivery does not. We build Abloomify's engineering analytics, and this is the pattern we see most when a team connects Cursor, Copilot or Claude Code to its GitHub data for the first time.
Key Takeaways
Q: What is the AI productivity paradox?
A: It is the gap between faster code production and unchanged delivery. Developers using AI tools generate more code and more pull requests, but review queues, rework and integration absorb the gain. Cycle time and throughput barely move, so the speedup never reaches customers.
Q: Why aren't AI coding tools making teams faster?
A: Writing code was only one constraint. AI raises pull request volume and size, which lands on the same human reviewers. Without changes to review capacity and work-in-progress limits, the bottleneck moves downstream instead of disappearing.
Q: What does the research say?
A: It is mixed. The 2024 DORA report linked a 25% rise in AI adoption to a 1.5% drop in delivery throughput and a 7.2% drop in stability. A 2025 METR trial found experienced developers 19% slower with AI tools, though they believed they were faster.
Q: How do I check whether it is happening on my team?
A: Put AI adoption next to PR cycle time, time to first review, PR size and rework rate, by team, over the same weeks. Abloomify does this join automatically from Cursor, Claude Code, Copilot and GitHub, with no code content stored.
Why do teams code faster with AI but not ship faster?
Teams code faster with AI but do not ship faster because writing code is only one stage in a delivery pipeline, and AI speeds up that stage while loading more work onto the stages after it. A developer can now open more pull requests per week, and each one still needs a human to read it, a pipeline to test it and someone to merge it. If review capacity stays the same while PR volume and PR size grow, the queue in front of reviewers gets longer and the time from "opened" to "merged" stretches out. The developer feels fast because their part got quicker. The customer sees nothing, because the work is sitting in review. That is the whole paradox in one sentence: you sped up the cheap part of the system and starved the expensive part.
The idea is not new. Economist Robert Solow wrote in 1987 that "you can see the computer age everywhere but in the productivity statistics." Same shape, new tool.
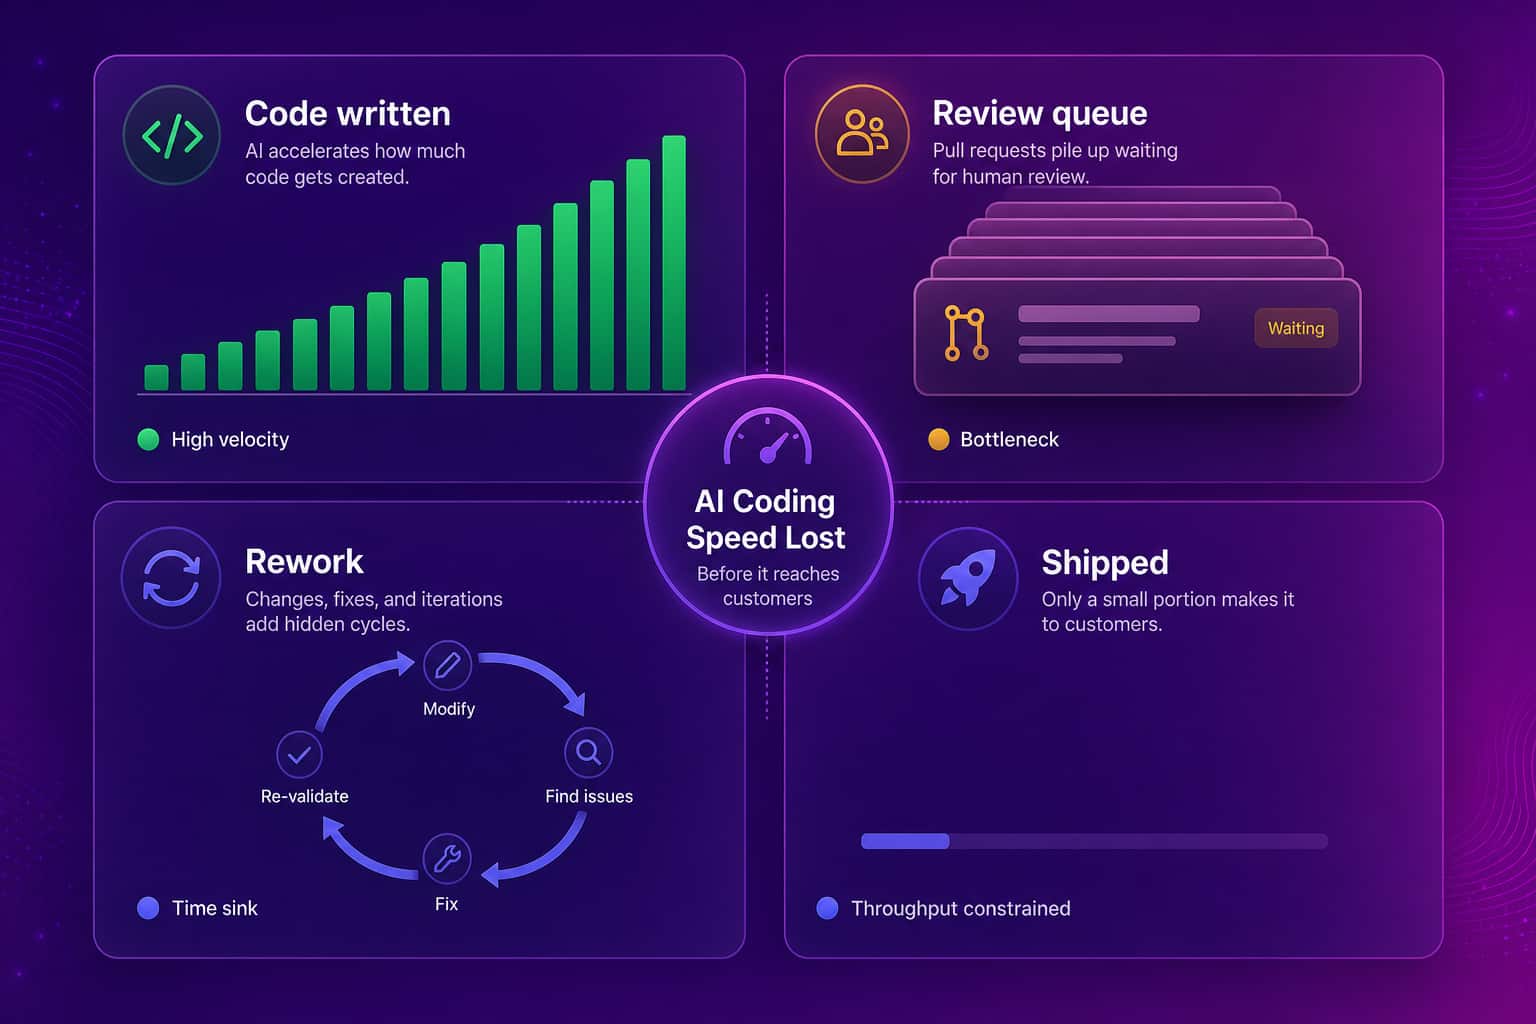
The tools made drafting cheap. Judgment stayed expensive, and that second part is where the queue forms.
What does the research say about the AI productivity paradox?
The research does not agree, and that disagreement is useful. Three sources are worth knowing. The 2024 DORA report from Google Cloud estimated that a 25% increase in AI adoption was associated with a 1.5% decrease in delivery throughput and a 7.2% decrease in delivery stability, while also finding small gains in documentation quality, code quality and code review speed. A 2025 trial by METR gave 16 experienced open-source developers 246 real tasks in their own repositories: with AI allowed, they took 19% longer, yet they had predicted a 24% speedup and still believed they were about 20% faster afterward. Faros AI, an engineering analytics vendor, analyzed telemetry from about 10,000 developers across roughly 1,255 teams and reported that engineers were completing about twice as many code changes while company-level metrics stayed flat, with PR review time up 91%. Treat the Faros numbers as vendor-reported correlations, not controlled results.
These are different methods on different populations, so do not average them into one headline. What they share is a warning: the number a developer feels and the number the system delivers can point in opposite directions. The METR result is the cleanest example. Even the people doing the work could not tell, which is why self-reported surveys are a weak way to judge an AI rollout.
Where does the AI speedup go?
The AI speedup mostly goes into four places: larger pull requests, a longer wait for first review, more rework after merge, and extra context-switching for the people reviewing. First, AI makes it easy to produce a big diff in one sitting, and large diffs are slower to review and more likely to hide defects. Second, review is done by a small number of senior people, so every extra PR adds to their queue and the wait for a first review grows. Third, generated code that looks plausible tends to come back for fixes, which shows up as rework rate. Fourth, reviewers jump between more, smaller-context changes, and the cost of that switching is paid in attention, not in a metric anyone tracks. None of these are visible in a tool's own usage dashboard. They only show up in delivery data.
That is also why the usual fix, "buy more seats," backfires. More adoption pushes more volume into the same four places. If you want the gain to land, you manage the pipeline around the tool: smaller PRs, a review rotation, WIP limits and a clear view of where work waits. Our guides on reducing code review cycle time and right-sizing diffs to cut PR churn cover the mechanics.
| Where the speedup leaks | What it looks like in the data | Where to look |
|---|---|---|
| Bigger pull requests | Median PR size climbs after rollout | PR size by team |
| Review queue | Time to first review grows | Review wait, reviewer load |
| Rework | More merged code changed again within days | Rework rate |
| Reviewer fatigue | Review depth drops, self-merges rise | Review depth, self-merge rate |
How do you measure the AI productivity paradox on your own team?
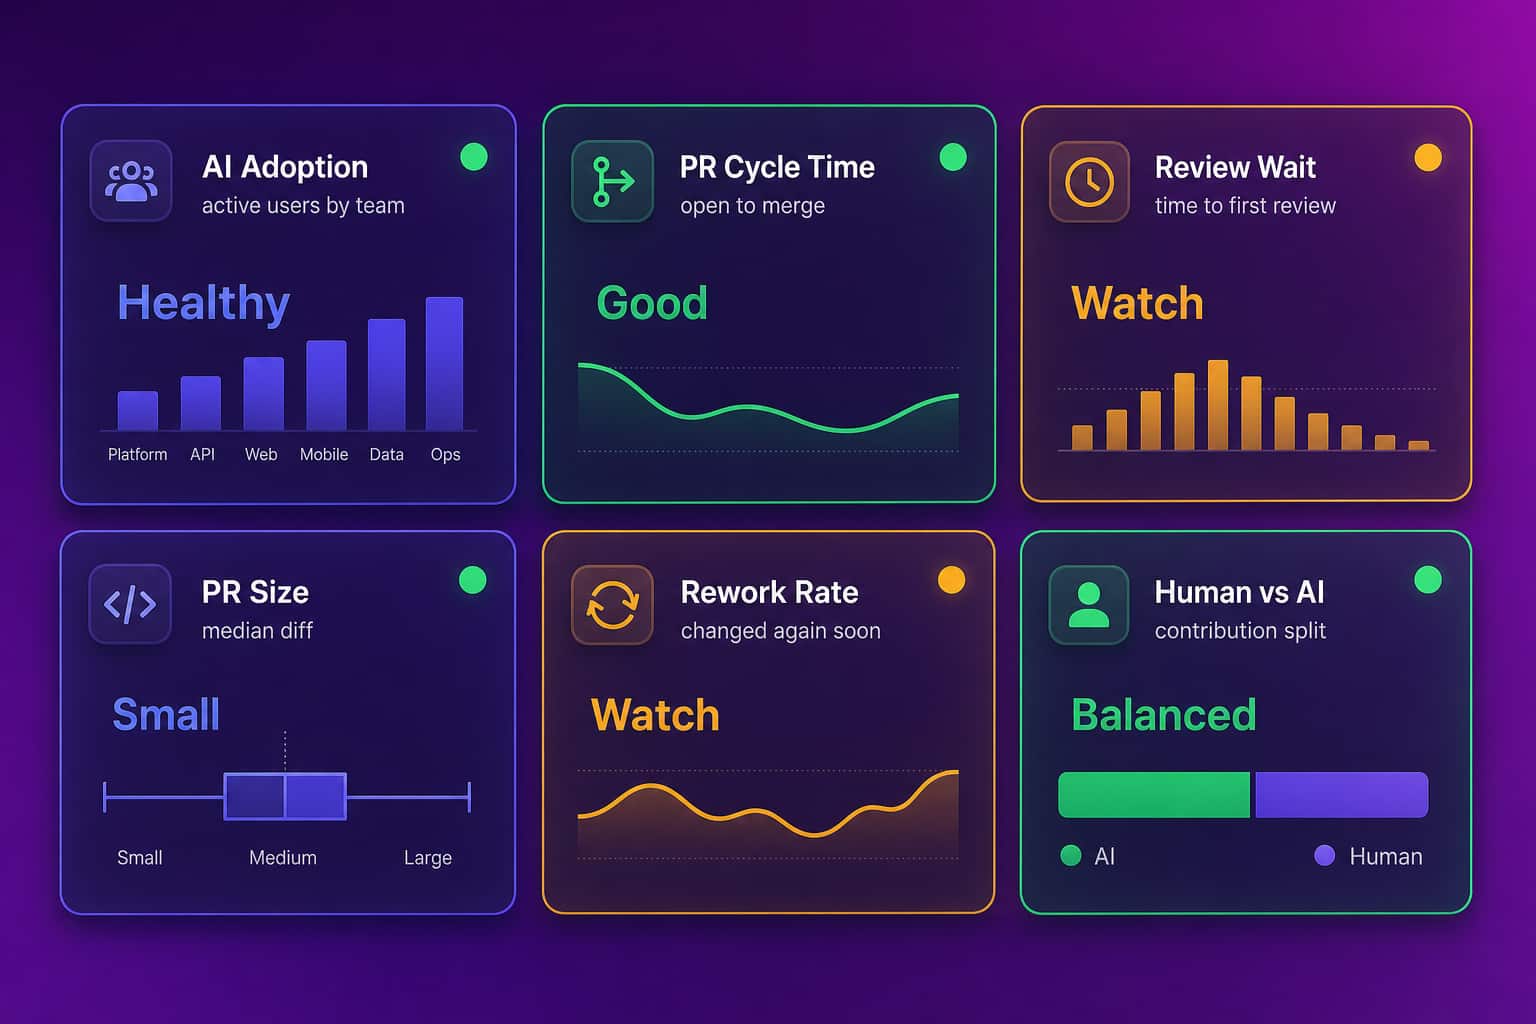
You measure it by putting AI adoption and delivery outcomes in one view, by team, over the same weeks, and comparing before and after rollout. Start with adoption: which teams actually use Cursor, Claude Code or GitHub Copilot, how heavily, and at what cost. Then line that up against the delivery signals AI should move: PR cycle time from open to merge, time to first review, PR size, rework rate and the four DORA metrics. A team with high adoption, shorter cycle time and flat rework is getting real value. A team with high adoption, flat cycle time and growing review wait is generating activity. You need both views at once, because either alone misleads. If you want the definitions behind those delivery numbers, see our explainers on DORA metrics and cycle time vs lead time.
Doing this by hand is where most efforts stall. Usage lives in the AI tool, delivery lives in GitHub and Jira, and nobody owns the join. Abloomify imports usage from Cursor, Claude Code and GitHub Copilot, correlates it with GitHub delivery data, and shows adoption by team, AI-assisted versus human-written lines, acceptance rate and cost next to PR flow. It also runs an AI-versus-human cohort comparison: do heavy adopters actually ship more and review faster? It is PII-free, so it reads usage and output signals, never your code.
Does felt speed match measured speed?
Felt speed and measured speed are different quantities, and the AI productivity paradox lives in the space between them. A developer's sense of pace comes from how quickly the next piece of code appears on screen. Measured speed is how long a change takes to get from idea to production. AI shortens the first and may leave the second untouched, which is why the METR participants could be slower and still report feeling faster. This matters for how you run an AI rollout, because the loudest evidence inside most companies is anecdote: engineers say they love the tool, managers see more commits, and a vendor dashboard shows a high acceptance rate. All of that is true and none of it answers the board's question. The only honest check is delivery data compared across the same teams, before and after.
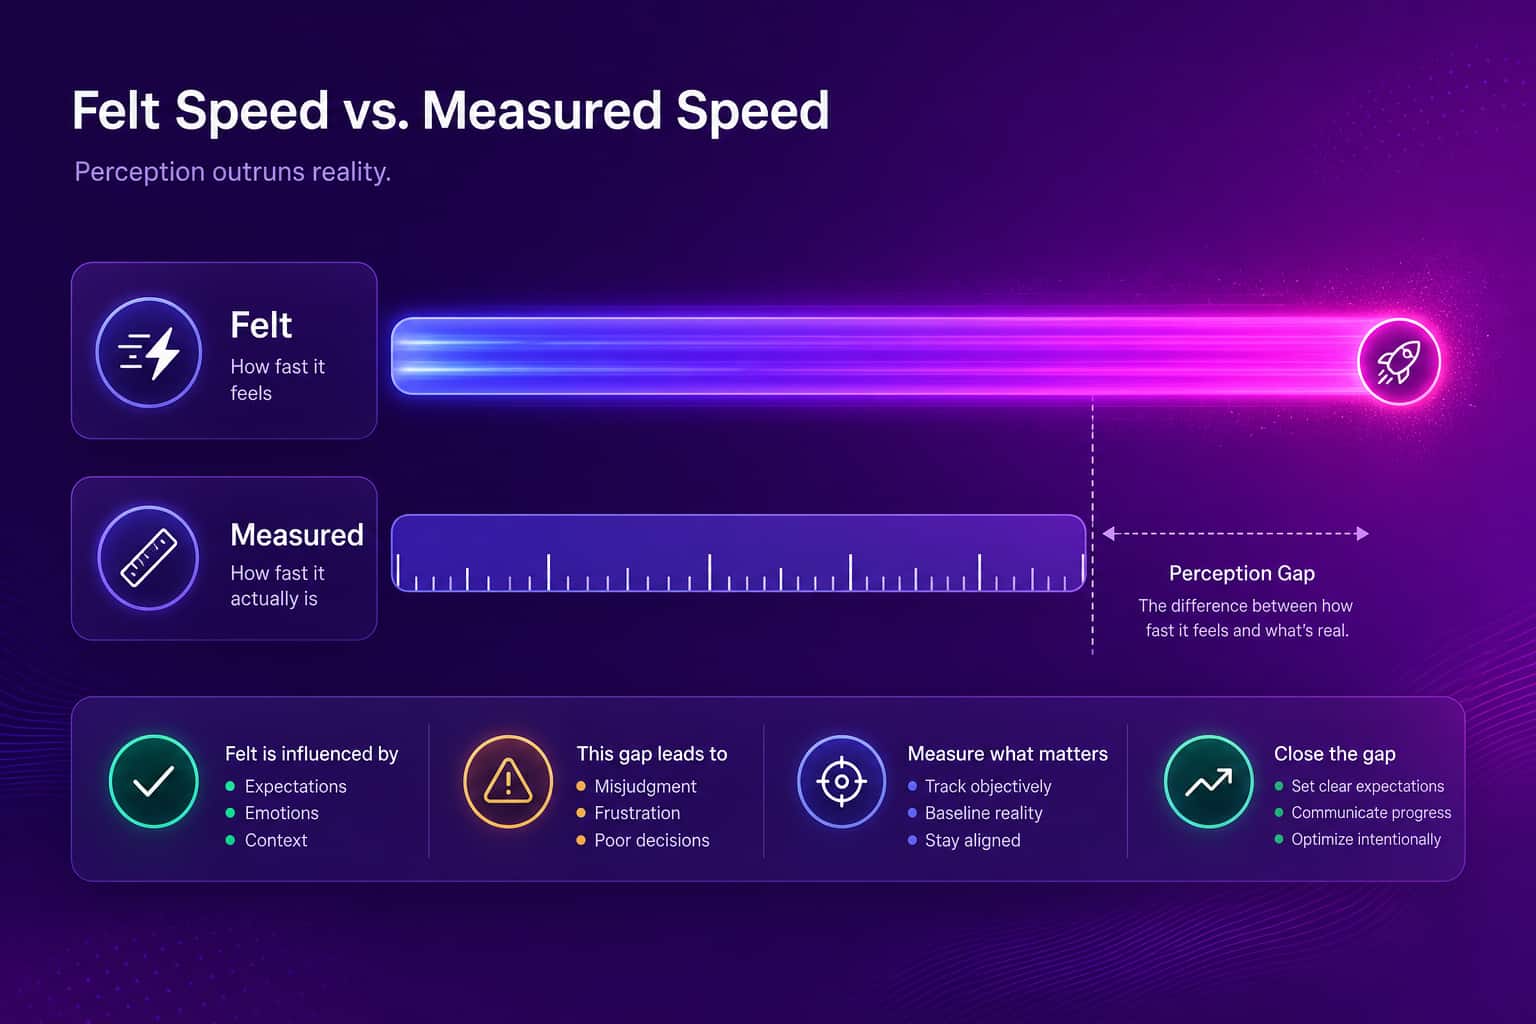
Amir has made the same point about AI generally: models are very good at making you feel confident. A usage chart does the same thing to a rollout. It feels like progress. Look at the cycle time instead.
What should engineering leaders do about it?
Engineering leaders should treat AI tools as a change to the whole delivery system and manage the review stage as hard as the writing stage. In practice that means five moves. Measure a baseline before the rollout, so you can compare afterward. Track delivery metrics by team, not just seat usage. Cap PR size and set a review-time target, so extra output does not pile up. Add reviewer capacity or a rotation where the queue is longest. And separate human from AI-agent contribution so you can see what each is actually producing, which matters when you justify the license budget or calibrate a review. Skip the "AI helps" versus "AI hurts" argument. Get your own numbers, per team, and act on them. Our write-ups on measuring AI adoption impact and GitHub Copilot metrics go deeper on the setup.
Some teams will come out ahead. Others will find they bought speed in the one place it did not matter. I think the second group is bigger than people admit, and I would rather know early.
FAQ
What is the AI productivity paradox?
The AI productivity paradox is the gap between how much faster individual developers produce code with AI tools and how little company-level delivery improves. Output per engineer rises, but review queues, rework and integration work absorb the gain, so cycle time and throughput barely move.
Is the AI productivity paradox real?
Partly. Some studies show speedups on isolated tasks, while the 2024 DORA report and a 2025 METR trial found delivery stability and experienced-developer speed moving the wrong way. Results depend on the team, the codebase and the review process, which is exactly why you should measure your own teams rather than trust an average.
Why are AI coding tools not making teams faster?
Writing code was never the only constraint. AI increases pull request volume and size, which lands on the same human reviewers, and generated code can raise rework. Unless review capacity, test pipelines and work-in-progress limits change as well, the bottleneck just moves downstream.
How do you measure the AI productivity paradox on your own team?
Track AI adoption by team next to PR cycle time, time to first review, PR size and rework rate across the same weeks, before and after rollout. Abloomify imports Cursor, Claude Code and GitHub Copilot usage and correlates it with GitHub delivery data, PII-free, so you do not build the join yourself.
Which metrics show whether AI tools are paying off?
Delivery metrics, not usage metrics. Watch PR cycle time, time to first review, PR size, rework rate and the four DORA metrics. Acceptance rate shows adoption only. If usage climbs while cycle time stays flat and review wait grows, the tool is producing activity rather than delivery. See engineering productivity analytics.

Reza Vatani
Co-Founder & CAIO
AI-driven entrepreneur with a strong background in robotics and advanced analytics. PhD from Old Dominion University and former Product Development leader at Nasdaq Verafin.