GitHub Copilot Metrics: What to Track and What They Mean
June 30, 2026
Reza Vatani
12 min read

GitHub Copilot metrics tell you how many engineers turned Copilot on, how often they accept its suggestions, and how much they chat with it. What they do not tell you is whether any of that made your team ship faster. GitHub's Copilot metrics API gives you usage. Abloomify connects that usage to delivery, so a seat count becomes a number you can actually defend to a board.
Key Takeaways
Q: What are GitHub Copilot metrics?
A: GitHub Copilot metrics are usage measurements from GitHub's Copilot metrics API: total active users, total engaged users, code completion acceptance rate, suggestions and lines accepted, and Copilot Chat activity, broken down by editor and language. They show adoption, not whether delivery improved.
Q: Where do GitHub Copilot metrics come from?
A: From the org-level Copilot metrics API (GET /orgs//copilot/metrics) and the Copilot usage reports. GitHub closed the legacy endpoints on April 2, 2026. The API only returns data when at least five members hold active Copilot licenses, a built-in privacy threshold.
Q: What is a good Copilot acceptance rate?
A: There is no universal benchmark, and chasing one is the wrong goal. Acceptance rate shows engineers find suggestions useful, not that the accepted code shipped value. A 2025 METR study found experienced developers were slower with AI tools even while feeling faster. Measure delivery, not acceptance.
Q: Can you track GitHub Copilot metrics per team?
A: Yes. GitHub added team-level Copilot usage metrics via API in May 2026, so you can compare adoption across squads. Abloomify rolls the same usage up against each team's delivery data, so you see which teams turn Copilot seats into faster shipping.
Q: How do you measure GitHub Copilot ROI?
A: Connect Copilot usage to delivery outcomes: PR cycle time, throughput, and rework rate, segmented by team, before and after rollout. Abloomify imports Copilot, Cursor, and Claude Code usage, correlates it with GitHub delivery data, and separates human from AI agent contribution, PII-free.
What are GitHub Copilot metrics?
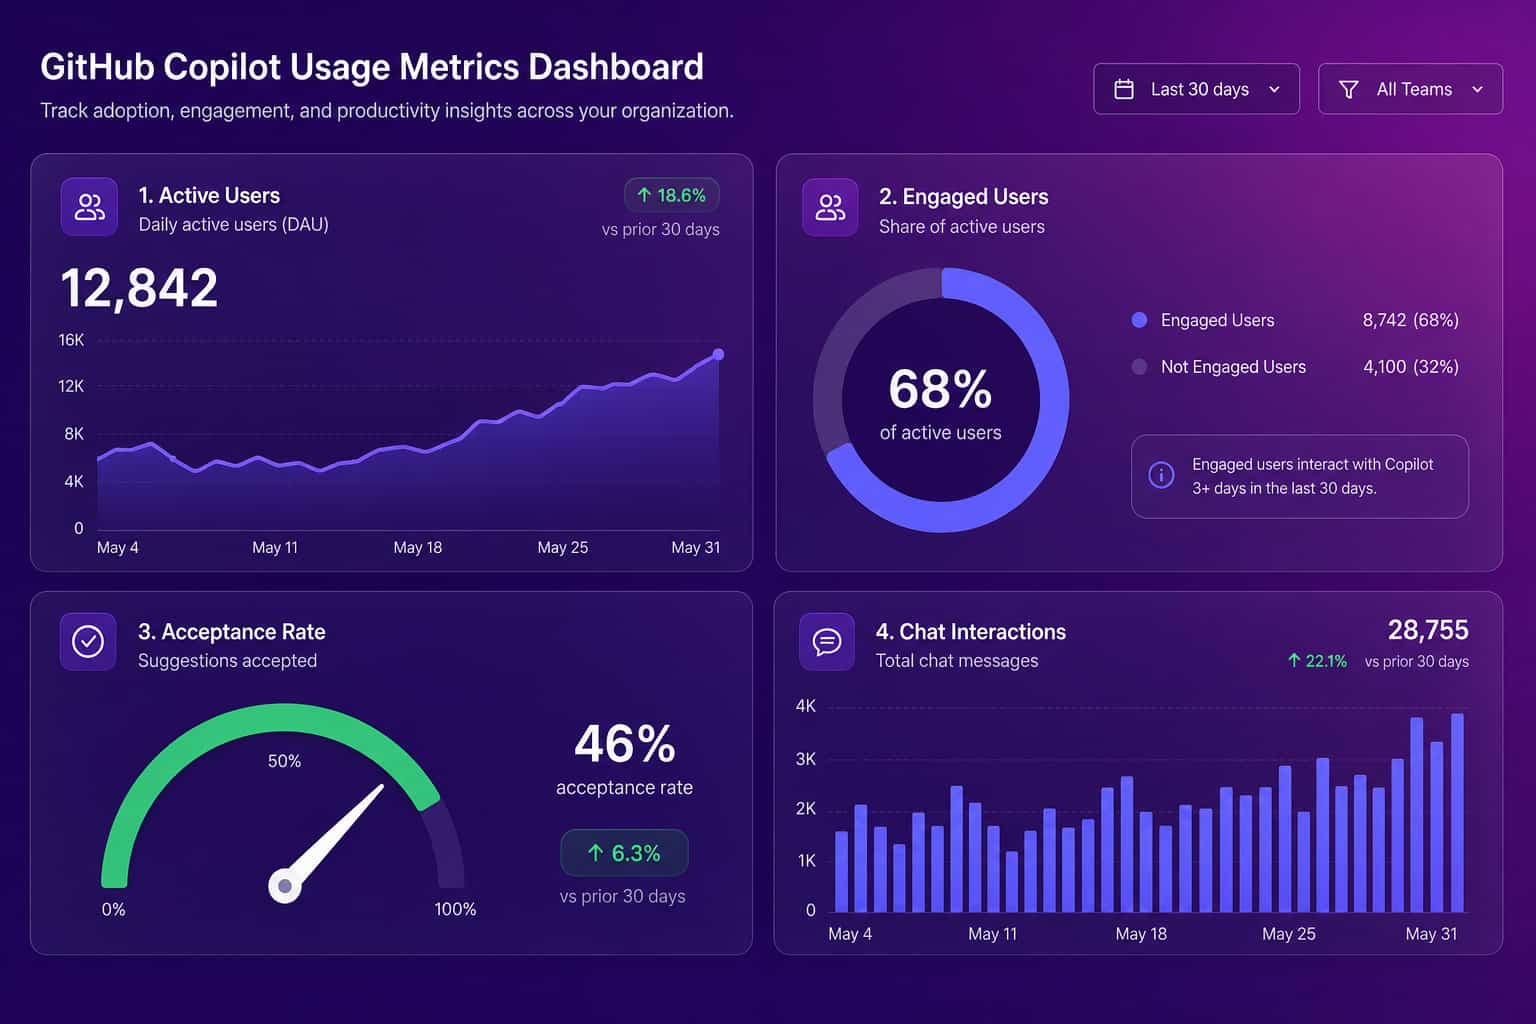
GitHub Copilot metrics are the usage measurements GitHub exposes for an organization's Copilot deployment, covering how many developers use it, how often they accept its code completions, and how much they rely on Copilot Chat. The core fields are total active users (anyone who used Copilot at all in a day), total engaged users (those who actually interacted with a feature), code completion data (suggestions shown, suggestions accepted, and lines accepted, split by editor and programming language), and Copilot Chat activity. You read them through the Copilot metrics API or view them in a dashboard like the open-source copilot-metrics-viewer. They answer one question well: is Copilot being adopted. They say nothing about whether that adoption changed how fast your team delivers software, which is the question your CFO will actually ask at renewal.
That distinction matters more than it sounds. Adoption is a leading indicator, not an outcome. A team can show 90% active users and a healthy acceptance rate and still ship at the same pace it did before the rollout. The metrics are real and useful, but they are the start of the analysis, not the end of it.
Where GitHub Copilot metrics come from: the API and dashboards
GitHub Copilot metrics come from the organization-level Copilot metrics API, primarily the
GET /orgs/{org}/copilot/metrics endpoint and the newer Copilot usage reports, which return daily aggregated data you can pull on a schedule. GitHub closed the legacy Copilot usage endpoints on April 2, 2026, so current integrations should use the metrics and usage-report endpoints, which carry more depth (the current API version is dated 2026-03-10). Authentication needs a token with the read:org scope and the "View Organization Copilot Metrics" permission. One detail trips teams up: the API only returns data when at least five members hold active Copilot licenses, a privacy floor that prevents identifying individuals from small groups. In May 2026, GitHub added team-level usage metrics via API, so you can finally compare squads. Most teams either build on top of the raw API or use the open-source copilot-metrics-viewer to chart it.The raw API is fine for a one-time pull. The problem starts when you want this to be a standing part of how you run engineering. You end up writing a small ETL job, storing the daily snapshots somewhere, and stitching them next to your GitHub delivery data by hand. That stitching, usage on one side and outcomes on the other, is the actual work, and it is where most Copilot reporting quietly stalls.
The core GitHub Copilot metrics, and what each one means
The core GitHub Copilot metrics fall into three buckets, adoption, code completions, and chat, and each one tells you something narrow. Adoption metrics (total active users and total engaged users) tell you reach: who turned it on and who actually interacted with a feature that day. Code completion metrics (suggestions shown, suggestions accepted, lines accepted, and the derived acceptance rate, all split by editor and language) tell you whether engineers find the inline suggestions useful enough to keep. Chat metrics tell you how much your team leans on Copilot for explanations, refactors, and questions rather than raw completion. Read together, they describe behavior in the editor in real detail. What none of them describe is the thing on the other side of the editor: whether the pull requests came out faster, cleaner, or in greater number once Copilot was in the loop.
Here is how to read each one without over-reading it.
| Metric | What it measures | What it does not tell you |
|---|---|---|
| Total active users | Developers who used Copilot at all in a day | Whether usage was meaningful or incidental |
| Total engaged users | Developers who interacted with a feature | Whether that interaction helped them ship |
| Acceptance rate | Share of suggestions developers accept | Whether accepted code survived review or got reworked |
| Lines accepted | Volume of AI-suggested code kept | Whether more lines is good (often it is not) |
| Chat interactions | Reliance on Copilot Chat | Whether answers were correct or load-bearing |
| By editor / language | Where adoption concentrates | Where delivery actually improved |
The "lines accepted" metric deserves a warning. More AI-written code is not a goal. If acceptance and line volume climb while rework climbs with them, you have bought yourself more code to review and maintain, not more value. Volume is the easiest number to grow and the easiest to misread.
What GitHub Copilot metrics don't tell you
GitHub Copilot metrics measure activity in the editor, and activity is not delivery, which is the single most important thing to understand before you report any of these numbers upward. A team can post strong adoption and a high acceptance rate while its pull request cycle time, throughput, and defect rate sit exactly where they were a quarter ago. The metrics are blind to everything that happens after the suggestion is accepted: whether the code passed review without heavy rework, whether it shipped, whether it broke something in production two weeks later. They are also blind to the difference between a suggestion that saved an engineer twenty minutes and one that sent them down a confident wrong path. The research is direct on this. A 2025 METR study found experienced developers working in familiar codebases were measurably slower with AI tools even though they reported feeling faster, and Google's DORA program has linked rising AI adoption to throughput gains while warning about pressure on delivery stability.
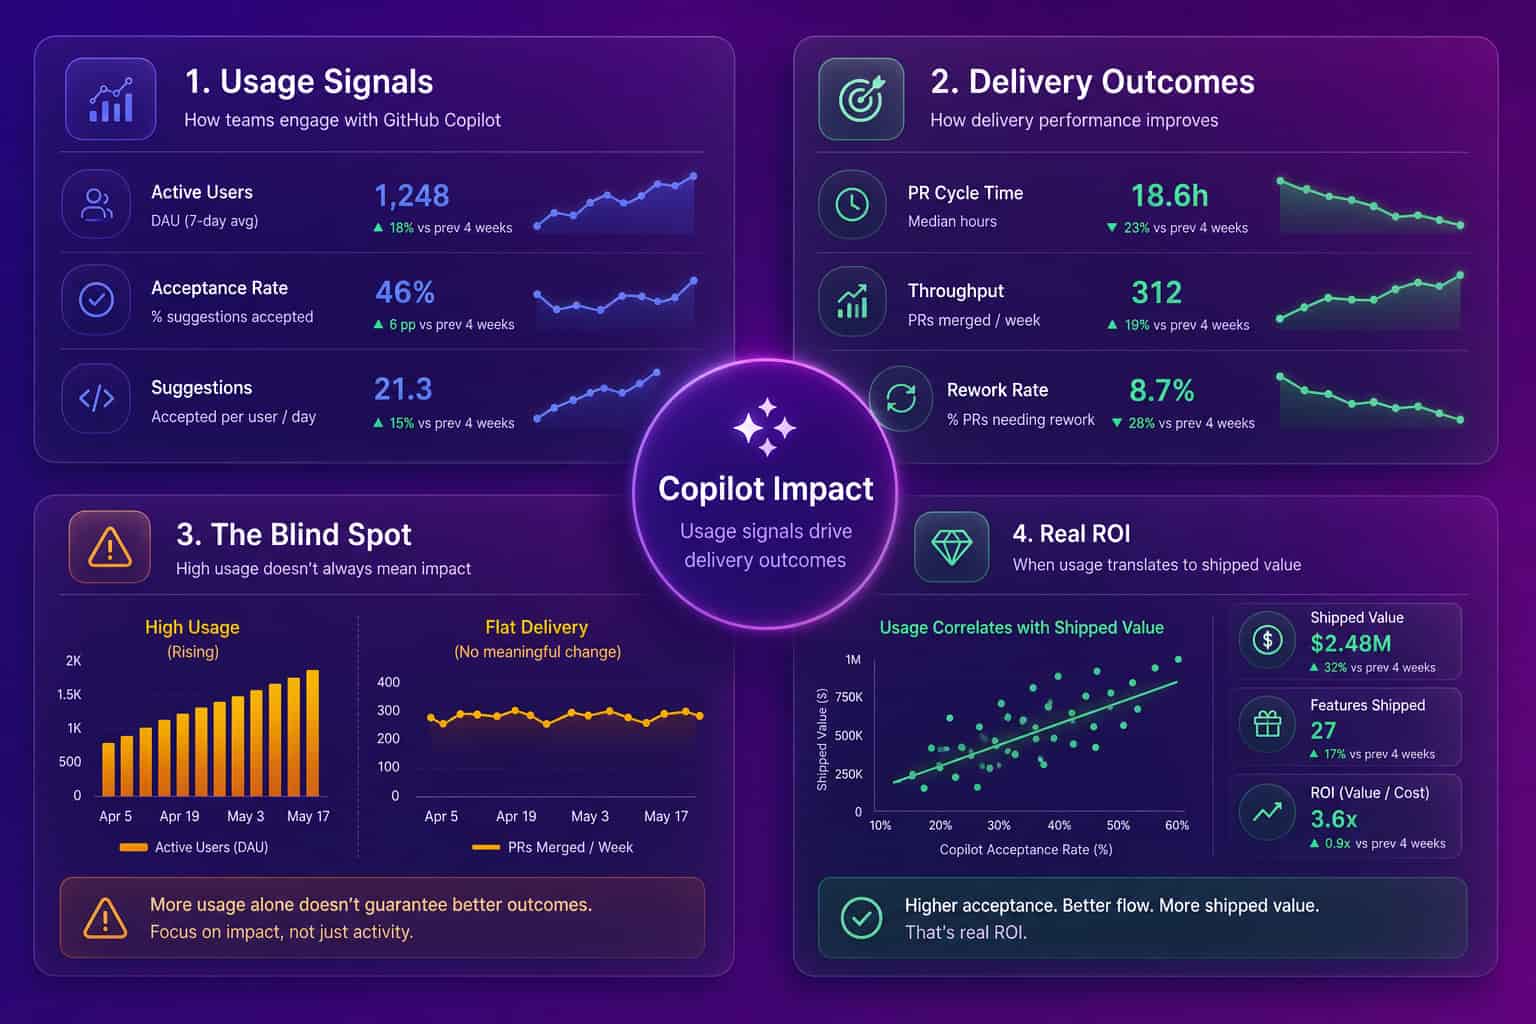
This is also why a single "good acceptance rate" benchmark is a distraction. There is no industry number that means Copilot is working for you, because the same acceptance rate can sit on top of a team that got faster and a team that got noisier. The benchmark that matters is your own delivery, before and after, segmented by team.
How to measure GitHub Copilot ROI, not just usage
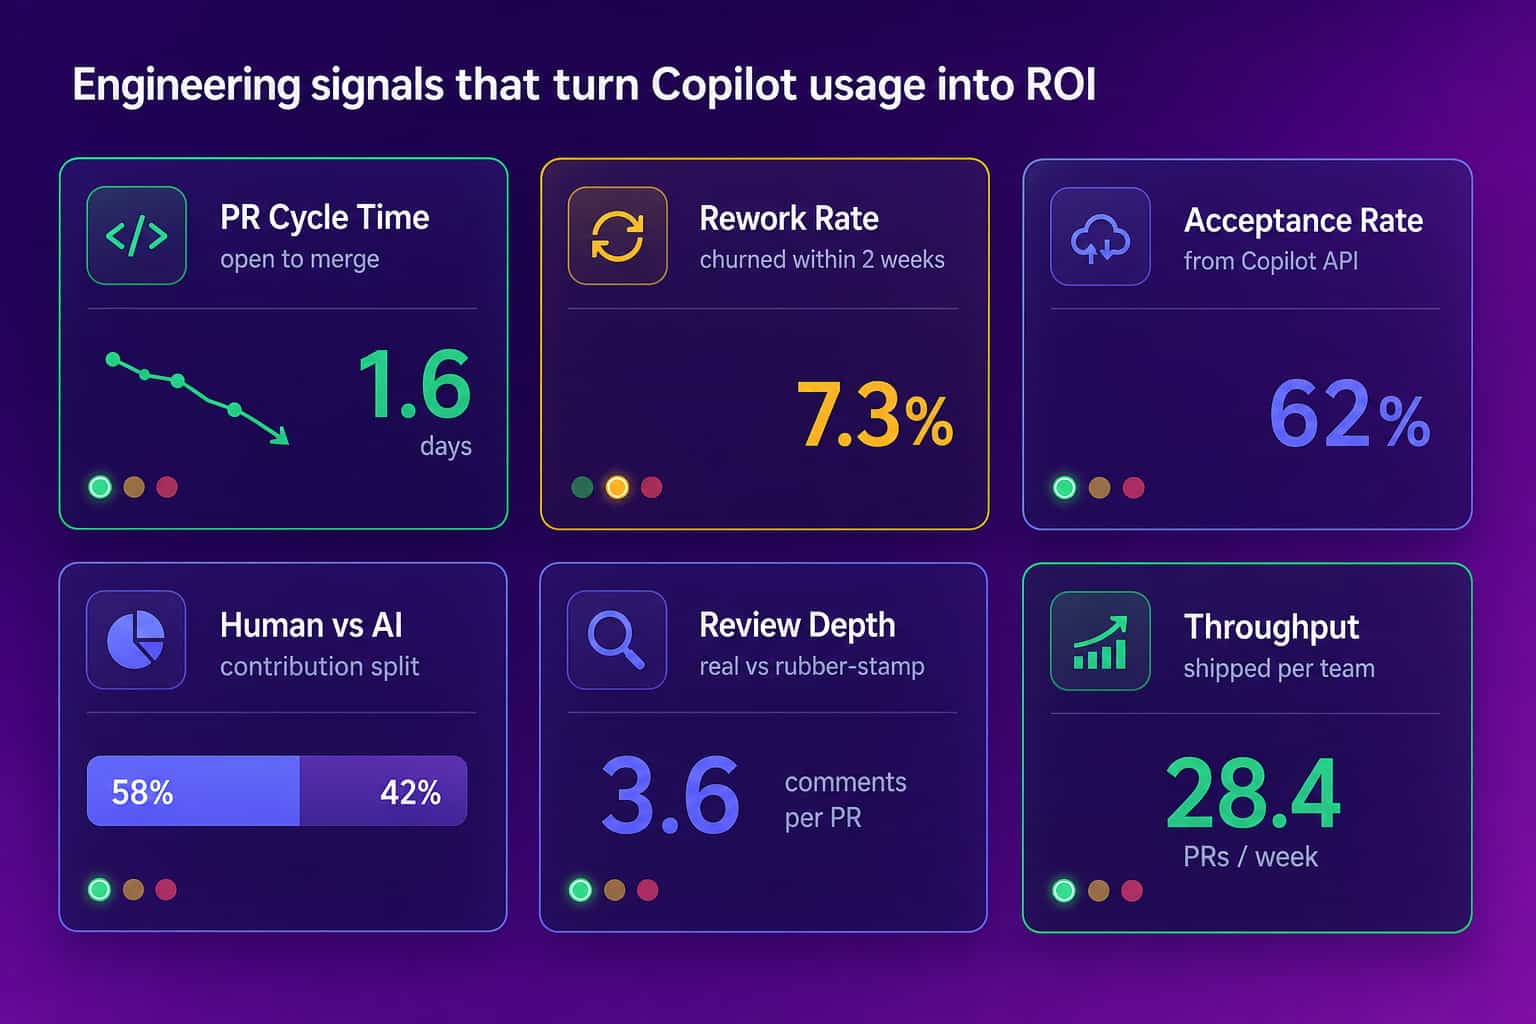
You measure GitHub Copilot ROI by putting usage and delivery in the same view and watching how they move together, not by reading either one alone. Pull the Copilot metrics (active users, acceptance rate, lines accepted) for each team, then line them up against that team's delivery outcomes over the same period: pull request cycle time from open to merge, throughput, review depth, and rework rate (how often merged code gets changed again within a week or two). If a team's usage is high and its cycle time dropped while rework stayed flat, Copilot is paying off there. If usage is high and cycle time is flat or rework is climbing, you have found a team that is busy, not faster, and that is a coaching problem, not a license problem. Doing this by hand across many teams is the part that breaks down, which is exactly what Abloomify automates. It imports usage from Cursor, Claude Code, and GitHub Copilot, connects it to GitHub delivery data, and separates human from AI agent contribution, PII-free, with no code content stored.
The contribution split is the piece raw Copilot metrics cannot give you. When an agent drafts a change, Copilot completes half of it, and a human clicks merge, the commit history credits the human with everything. That is fine until you are justifying an AI tool budget or calibrating a performance review, and then you need to see who actually did the work. This is the same outcomes-first approach Abloomify takes to developer productivity metrics and code review cycle time: signals from the systems where work already happens, never surveillance.
Turning Copilot metrics into a decision your board will trust
A Copilot metrics report your board will trust pairs every usage number with the delivery number it is supposed to influence, so nobody has to take adoption on faith. The format is simple: for each team, show Copilot adoption and acceptance next to PR cycle time, throughput, and rework, across the same weeks, with a clear before-and-after around the rollout. That single view answers the three questions leadership actually asks, which teams are getting value, which are paying for seats they barely use, and whether the spend is buying speed or just activity. It also kills the two failure modes at once: reporting adoption as if it were impact, and dismissing a tool that is quietly working because the usage chart looked flat. GitHub gives you the left half of that picture. Your delivery data is the right half. The value is in holding both at the same time, every week, without rebuilding the join by hand.
Copilot can write the code. Copilot metrics can tell you it was used. Knowing whether it made you faster is still a measurement problem, and that is the part you cannot hand to the model.
FAQ
What are GitHub Copilot metrics?
GitHub Copilot metrics are usage measurements from GitHub's Copilot metrics API: total active users, total engaged users, code completion acceptance rate, suggestions and lines accepted, and Copilot Chat activity, split by editor and language. They show adoption in real detail but say nothing about whether delivery improved, which is the question that matters at renewal.
How do I access the GitHub Copilot metrics API?
Use the org-level endpoint
GET /orgs/{org}/copilot/metrics with a token carrying the read:org scope and the "View Organization Copilot Metrics" permission. GitHub closed the legacy usage endpoints on April 2, 2026. The API only returns data when at least five members hold active Copilot licenses, and team-level metrics arrived via API in May 2026.What is a good GitHub Copilot acceptance rate?
There is no universal benchmark, and optimizing for one is a mistake. Acceptance rate tells you engineers find suggestions useful, not that the accepted code shipped value or survived review. The number that matters is your own delivery, PR cycle time and rework, measured before and after rollout and segmented by team, not a target acceptance percentage.
How do you measure GitHub Copilot ROI?
Line up Copilot usage against delivery outcomes for the same teams and weeks: PR cycle time, throughput, review depth, and rework rate. If usage is high and cycle time dropped while rework stayed flat, it is paying off. Abloomify automates this by correlating Copilot, Cursor, and Claude Code usage with GitHub delivery data, PII-free.
Can Abloomify track GitHub Copilot usage without reading our code?
Yes. Abloomify connects to GitHub and your AI coding tools for usage and delivery signals only. It does not read or store code content, so you can measure Copilot ROI and separate human from AI agent contribution without exposing source. See engineering productivity analytics for how the delivery side fits together.
Reza Vatani
Co-Founder & CAIO
AI-driven entrepreneur with a strong background in robotics and advanced analytics. PhD from Old Dominion University and former Product Development leader at Nasdaq Verafin.