Claude Code Usage: How to Track It Across a Team
October 2, 2026
Reza Vatani
8 min read

Claude Code usage means two different things depending on who is asking. A developer wants to know how much of their plan is left today. An engineering leader wants to know whether 80 paid seats turned into shipped work. This guide covers both, and Abloomify handles the second one by importing Claude Code usage and correlating it with GitHub and Jira output.
Key Takeaways
Q: How do I check my own Claude Code usage?
A: Run /usage inside Claude Code to see your standing against plan limits, or /cost if you are on API billing. Both answer an individual question. They do not tell you how a team of 50 engineers is adopting the tool or whether it changes delivery speed.
Q: Why is individual usage data not enough for a team?
A: Because a team decision needs a comparison. Seats purchased, weekly active developers, and shipped output are three different numbers. Abloomify imports Claude Code usage and sets it beside PR cycle time and review health from GitHub, so the question becomes whether usage moves output.
Q: Can I measure Claude Code usage without watching developers?
A: Yes, and you should. Aggregate team signals answer the leadership question. Abloomify uses PII-free signals from work tools, with no screenshots, no keyloggers, and no screen recording. Prompt content stays out of the metrics entirely.
Q: What should I compare Claude Code usage against?
A: Compare it against your other AI tools and against output. Abloomify tracks Cursor, Claude Code, and GitHub Copilot usage in one place, then runs an AI-versus-human cohort comparison so you can see whether heavy adopters ship and review faster.
How Do You Check Your Own Claude Code Usage?
Inside Claude Code, the /usage command shows how much of your plan limit you have consumed, and /cost shows token spend for the current session if you pay through the API. Those two commands answer the personal question in seconds: am I about to hit a limit, and which habits are burning it. Long sessions that keep re-reading a large codebase, big pasted logs, and agents left running on vague tasks tend to be the expensive ones. Anthropic changes limits and plan details fairly often, so read the current numbers in the Claude Help Center instead of trusting a blog post, including this one. If you only need to stay under your own cap, you can stop reading here. If you are responsible for a team, the individual view is where your problem starts.
Why Per-Developer Usage Numbers Stop Working at Team Scale
A per-developer number tells you what one person consumed. It cannot tell you whether the team got anything for it. Suppose 80 engineers have Claude Code seats. Maybe 30 use it every week, 20 tried it once, and 30 never opened it. The same finance line item hides all three groups. And the heavy users are not automatically the productive ones: someone can burn a lot of tokens rewriting the same function four times. So usage alone is a cost metric. It becomes an ROI metric only when you set it next to what shipped, how fast it was reviewed, and whether it broke anything. That means pulling Claude Code activity together with GitHub and Jira data, per team, over the same weeks. Doing that in a spreadsheet works for one quarter. By the second quarter somebody has stopped updating it, and the decision goes back to anecdotes.
What to Track: Four Layers of Claude Code Usage Data
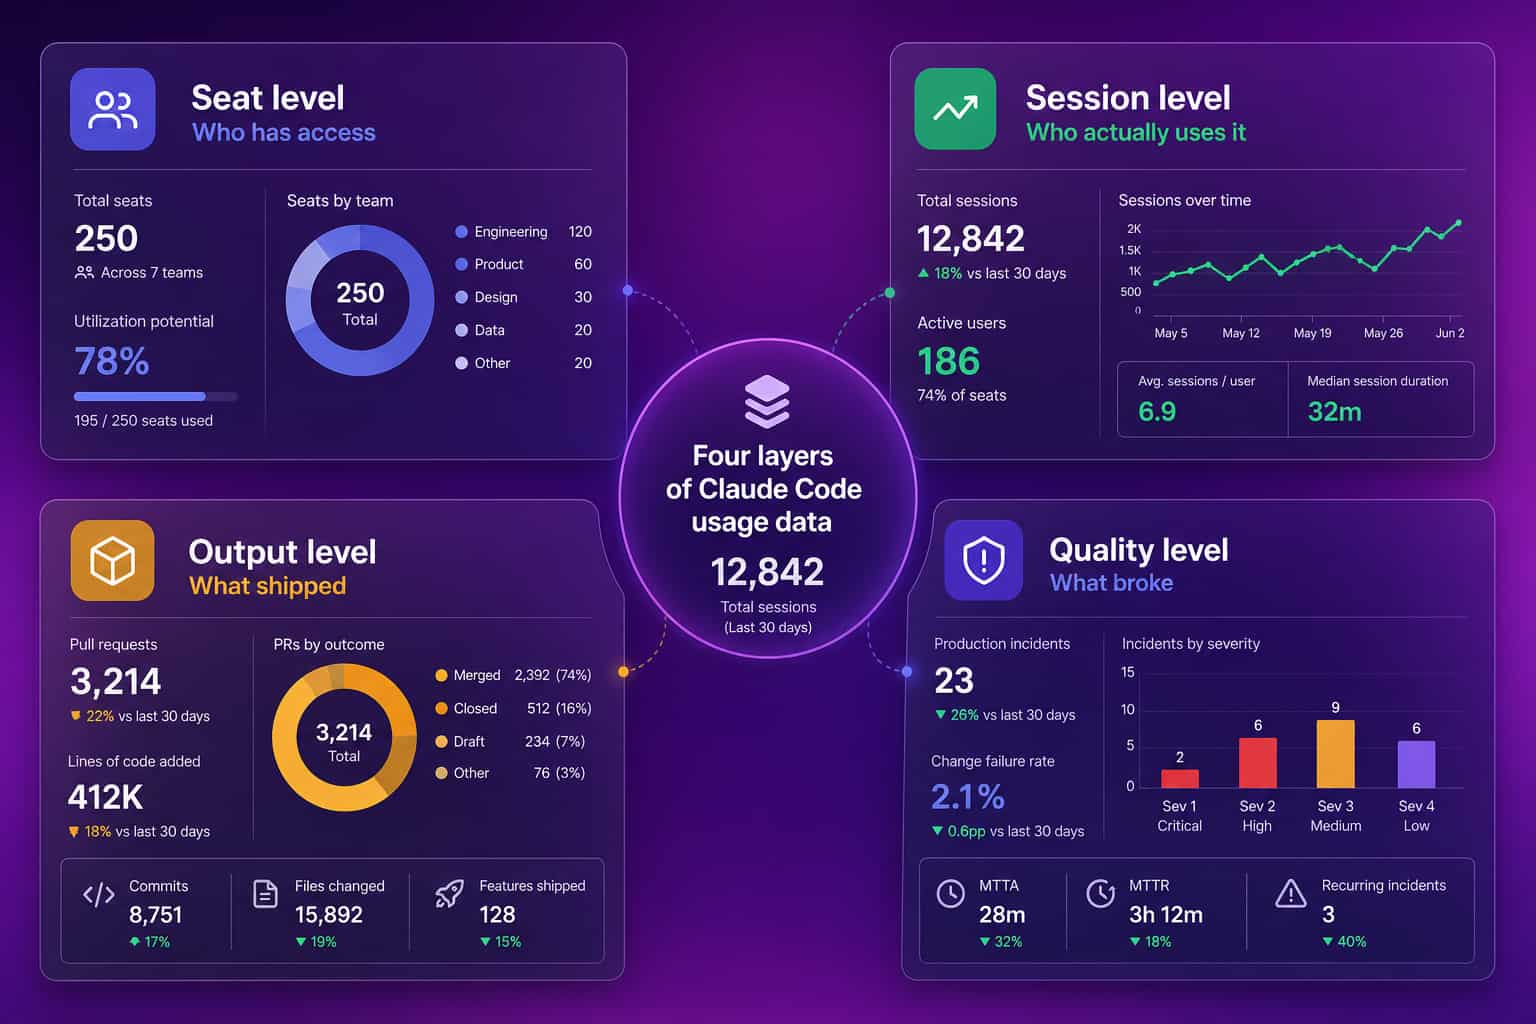
Track Claude Code usage in four layers and keep them separate, because each answers a different question. Seat level tells you who has access. Session level tells you who actually uses it, and how often per week. Output level tells you what shipped: PRs opened, merged, and how long they took. Quality level tells you what broke: review churn, reverts, change failure rate. Most teams stop at the first layer, because it comes from an invoice. The interesting gap lives between layers one and two (paid but unused), and between layers three and four (shipped fast but broke more). Abloomify is built around the second half of that chain. It connects GitHub and Jira to the AI tool data and bands the DORA metrics, so layers three and four are not a manual export.
| Layer | Question it answers | Typical source |
|---|---|---|
| Seat | Who has access? | Billing, admin console |
| Session | Who uses it weekly? | Claude Code usage data |
| Output | What shipped, how fast? | GitHub, Jira |
| Quality | What broke afterward? | Reverts, failed deploys, review churn |
How Do You Measure Claude Code ROI Without Surveillance?
You measure Claude Code ROI by comparing groups, not by watching people. Split developers into cohorts by how much they use the tool, then compare PR cycle time, review time, and change failure rate across cohorts over the same weeks. If the heavy cohort ships faster and does not break more, the tool is paying for itself. If it ships faster and breaks more, you have a review problem, and the fix is process, not fewer seats. Abloomify imports Claude Code, Cursor, and GitHub Copilot usage and runs this AI-versus-human cohort comparison, and it separates human, AI-agent, and bot contribution across code, PRs, and reviews. The signals are PII-free: no email content, no message content, no file content, and the optional device agent sends aggregated metrics with no screenshots and no keylogging. Individual surveillance would also wreck the trust you need for engineers to be honest about where the tool helps.
Claude Code, Cursor, and Copilot: Look at the Whole AI Stack
Most teams run more than one AI coding tool, and judging Claude Code in isolation gives a skewed answer. One group may use Cursor for editing and Claude Code for larger agentic tasks. Another may have Copilot seats nobody opens. If you only look at Claude Code, you cannot tell whether a productivity change came from it or from the shift in the whole toolset. A single view across tools lets you ask the useful questions: which tool is each team actually using, are people paying for overlapping seats, and where are the adoption gaps. Our comparison of Cursor vs Claude Code covers how the two differ as tools, and GitHub Copilot metrics covers the Copilot side. For the broader measurement picture, see how to calculate AI ROI.
Giving Claude Code Your Company Context Raises Usage Quality
Usage volume is half the picture. The other half is whether each session starts from company knowledge or from zero. Abloomify's External AI Access connects Claude Code, Cursor, Claude Desktop, ChatGPT, and Codex to company knowledge through MCP, with scope controls and instant revocation. The device agent can also sync a team's AI coding sessions into the shared knowledge base, so a problem one engineer solved on Tuesday is searchable by another on Wednesday. This is where I think the value compounds. Raw token counts reward sessions that re-explain the same context over and over. A team that stores and reuses its answers needs fewer sessions for the same output, and that is a better outcome than a bigger usage graph. Setup details are in our MCP connection guide.
FAQ
How do I check my Claude Code usage?
Run the /usage command inside Claude Code to see where you stand against your plan limits. API users can run /cost to see token spend for the current session. For a team, the individual view is not enough, so most engineering leaders also look at admin analytics and connect usage to engineering output.
Does Anthropic provide Claude Code usage analytics for teams?
Yes. Anthropic documents usage analytics for Claude Code in its help center, and they cover activity on the Claude side. They do not tell you what happened after the session, such as which pull requests merged, how long review took, or whether incidents followed. That second half needs data from GitHub and Jira.
Can I track Claude Code usage without monitoring developers?
Yes. Track aggregate adoption and output at the team level, not keystrokes or prompts. Abloomify collects PII-free signals from work tools and optional aggregated device metrics. It does not take screenshots, record screens, or capture prompt content, so the numbers describe teams and workflows instead of watching individuals.
What is a good Claude Code adoption rate?
There is no honest universal benchmark, and anyone quoting one is guessing. Compare your own teams to each other and to their own history. A useful signal is the gap between teams with seats and teams with weekly active use, then whether the active teams ship and review faster than the others.
How do I measure Claude Code ROI?
Compare cohorts. Group developers by how much they use Claude Code, then compare PR cycle time, review time, and change failure rate across the groups over the same weeks. Abloomify imports Claude Code usage and correlates it with engineering output, so heavy adopters and light adopters can be compared directly.

Reza Vatani
Co-Founder & CAIO
AI-driven entrepreneur with a strong background in robotics and advanced analytics. PhD from Old Dominion University and former Product Development leader at Nasdaq Verafin.