Change Failure Rate: How to Calculate It and What Is a Good One
October 7, 2026
Amir Tavafi
12 min read

Change failure rate is the percentage of your deploys that cause a problem in production and need a rollback, hotfix, or patch. It is one of the four DORA metrics, and it is the easiest one to game by accident. Abloomify's engineering productivity analytics detect change failures automatically from failed deploys and reverts in GitHub, so the count does not depend on someone remembering to log an incident.
Key Takeaways
Q: What is change failure rate?
A: Change failure rate is the share of production deployments that cause a failure and need remediation, such as a rollback or hotfix. It is one of the four DORA metrics. Abloomify computes it from GitHub, bands it Elite, High, Medium, or Low, and shows it next to deployment frequency, lead time, and recovery time.
Q: How do you calculate change failure rate?
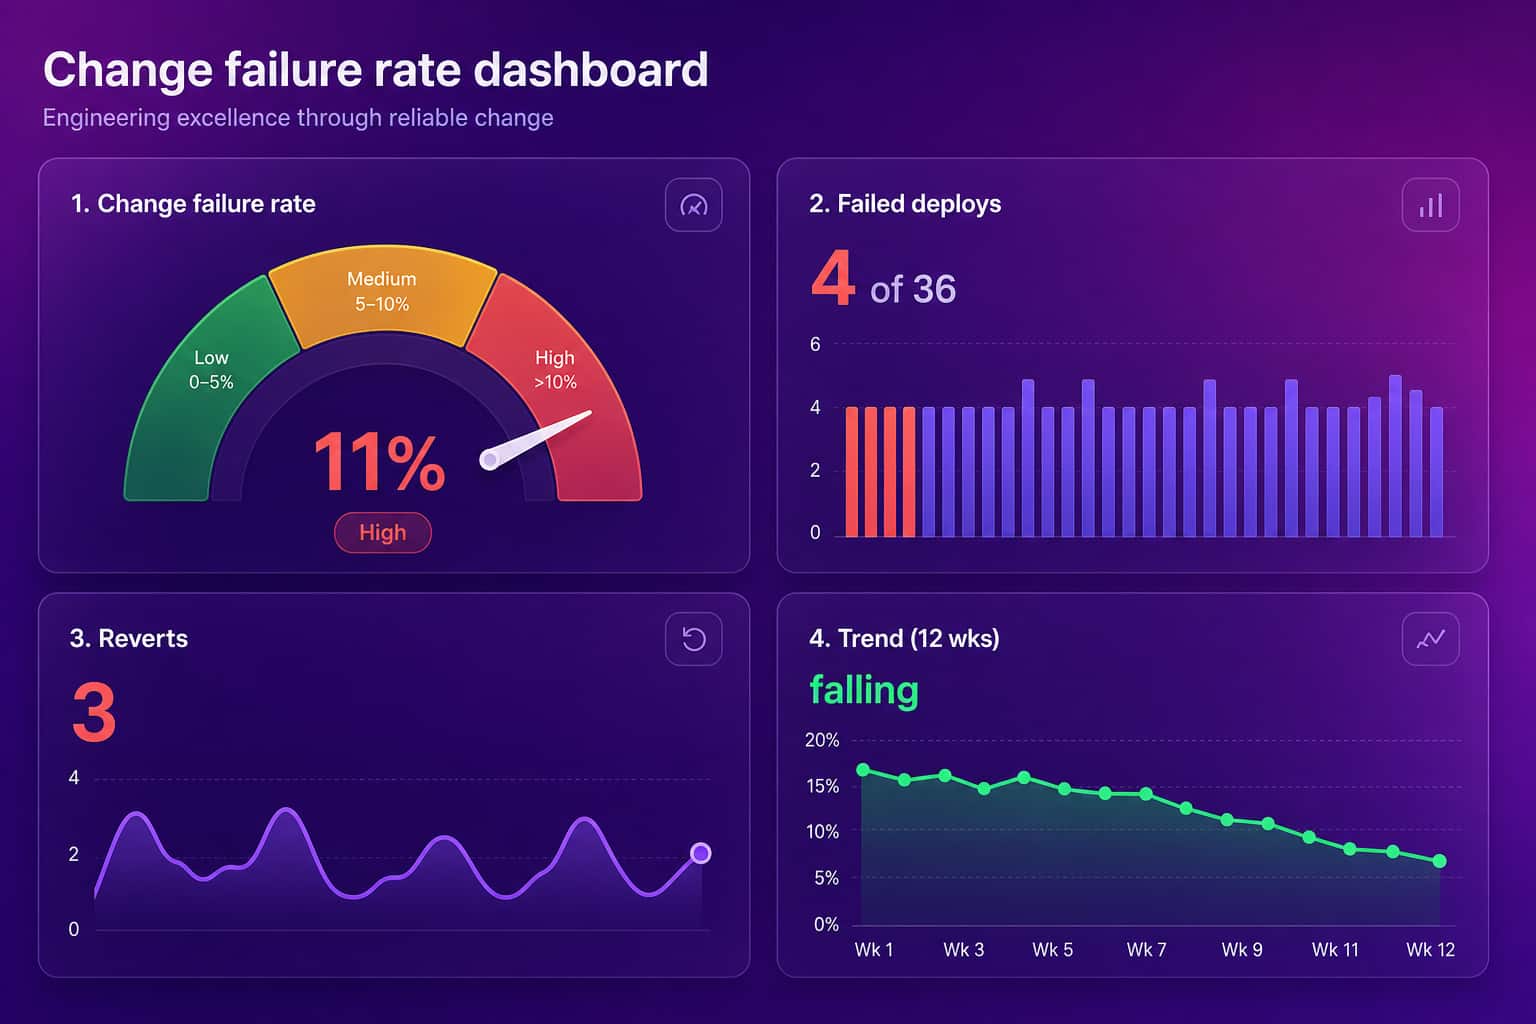
A: Divide failed deploys by total deploys in the same window and multiply by 100. Four failed deploys out of 36 is about 11 percent. The formula is trivial. The decision about what counts as a failure is the part that decides whether the number means anything.
Q: What is a good change failure rate?
A: DORA research puts elite teams at roughly 0 to 15 percent. But a stable rate while you deploy more often beats a perfect rate on a team that ships once a month. Compare to your own trend first, and use the bands as direction.
Q: How do you lower it?
A: Ship smaller changes, review them properly, and fix the flaky tests that teach everyone to ignore a red pipeline. Abloomify tracks PR size and review health next to change failure rate, so you can see whether big batches are the reason deploys break.
What Is Change Failure Rate?
Change failure rate is the percentage of production deployments that lead to a degraded service or an outage and need some form of remediation, usually a rollback, a hotfix, or a forward-fix patch. It comes out of the DevOps Research and Assessment (DORA) work at Google, which treats it as the stability counterweight to speed. Deployment frequency and lead time tell you how fast you move. Change failure rate tells you how often that speed costs you something. A team that deploys ten times a day looks great until you learn that three of those ten deploys get reverted before dinner. The metric exists to stop you from celebrating throughput that is quietly broken. It counts deploys, not bugs, and not incidents. One bad deploy can create five bug tickets and one incident. For change failure rate it is still one failed change out of however many you shipped. That framing matters, because it keeps the conversation on how changes get made and released, not on who wrote the line that broke.
My own definition when I explain it to a non-engineer: out of every ten times we push to production, how many times do we have to undo or patch something right after? If the answer is one, that is a conversation. If the answer is four, that is a different conversation.
How to Calculate Change Failure Rate (With a Real Example)
To calculate change failure rate, divide the number of deployments that caused a production failure by the total number of deployments in the same period, then multiply by 100. Suppose your team shipped 36 times last month, and 4 of those deploys were followed by a rollback or a hotfix within a day. That is 4 divided by 36, or about 11 percent. The arithmetic takes ten seconds. The trouble is everything around it. You have to pick a window (a month is usually enough to smooth the noise), a definition of "production deploy" that you apply to every repo the same way, and a rule for linking a failure back to the deploy that caused it. A common rule is that a rollback or a hotfix within 24 hours of a deploy marks that deploy as failed. Whatever you pick, write it down before you calculate anything and do not change it midyear, or your trend line turns into fiction.
| Choice | Option A | Option B | What I would pick |
|---|---|---|---|
| What is a deploy | Every merge to main | Every release that reaches production | Every release that reaches production |
| What is a failure | Sev-1 incidents only | Any rollback, hotfix, or forward-fix | Any rollback, hotfix, or forward-fix |
| Linking window | Same day | Within 24 to 48 hours | Within 24 hours |
What Counts as a Failed Change?
A failed change is any production deployment that leads to degraded service or needs remediation, which includes a rollback, a hotfix, a forward-fix patch, or a manual intervention to restore normal behavior. That definition is deliberately broad, and the broadness is the point. If you only count Sev-1 incidents, your change failure rate will look wonderful and tell you nothing, because most failed changes are small and quiet. A checkout button that breaks on Safari for two hours is a failed change. A feature flag that needs flipping off ten minutes after release is a failed change. A migration that gets reverted is a failed change. What does not count is a failure with no link to a change, like a cloud provider outage, or a bug that shipped months ago and only now got noticed. Those are real problems. They just belong to reliability and incident tracking, not to this metric. When in doubt, ask one question: did a change we released cause this, and did we have to undo or patch it? If yes, count it.
The manual way to track this is a spreadsheet that someone updates after each postmortem. It works until the week that person is on vacation. The automated way is to read the signals your tools already produce. Abloomify detects change failures from failed deploys and reverts in GitHub, with per-repo awareness of which workflow is the production one, so a staging deploy that goes red does not pollute the number. It reads delivery signals only, which is what keeps the approach privacy-first: no screenshots, no keystroke tracking, no content capture.
What Is a Good Change Failure Rate?
A good change failure rate is one that is low enough to trust your releases and stable as you ship more often. The DORA research bands elite teams at roughly 0 to 15 percent, and high, medium, and low performers sit in wider ranges above that. Those bands are useful for a gut check, and I would treat them as a compass instead of a target. A 12-person startup shipping a consumer app and a 3,500-person company running regulated payments do not share the same tolerance for failure. Two things matter more than the label. First, direction: is your rate flat or falling quarter over quarter? Second, the pairing: is it holding steady while deployment frequency goes up? If you double your deploys and your rate stays at 11 percent, you have improved, because you now have twice as many failed deploys to learn from per month but each one is smaller and cheaper. If the rate climbs with frequency, you are shipping faster than your safety nets can handle. Our guide to DORA metrics covers how the four fit together.
Why a Zero Percent Change Failure Rate Is a Red Flag
A change failure rate of exactly zero usually means one of three things: the team ships rarely, the team bundles changes into huge releases that get tested to death, or failures are happening and nobody is recording them. None of those is a healthy state. Shipping rarely hides risk in bigger batches. Bundling creates the monster release that eventually breaks in a way nobody can untangle. And unrecorded failures are just a measurement gap wearing a nice number. Some failure is the price of shipping often, and the goal is not to eliminate it but to make each failure small, visible, and quick to undo. I would honestly rather see a team at 8 percent that deploys daily and rolls back in minutes than a team at 0 percent that deploys quarterly. The second team has not solved anything. They have just made the failures rare and enormous. This is also why change failure rate should never be a performance target for individuals. The moment you attach a bonus to it, people stop recording failures. Use it as a system signal, and review the slowest or ugliest failure each month instead of arguing about the percentage.
How to Lower Your Change Failure Rate
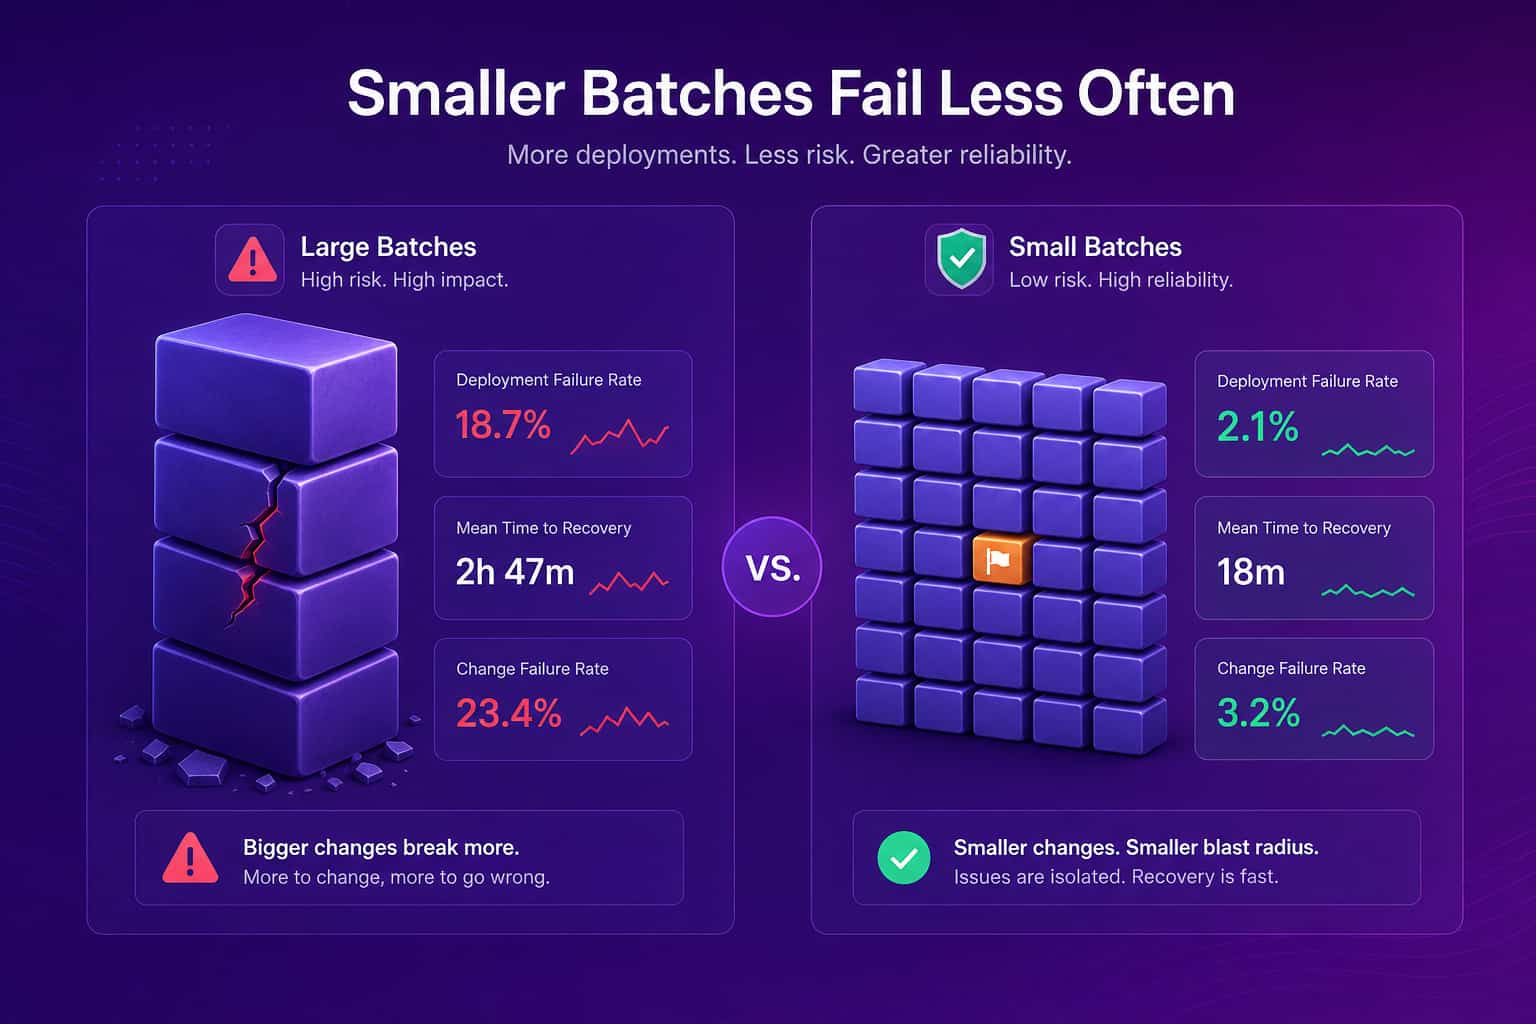
Three things lower change failure rate, and none of them is a dashboard. The first is smaller changes. A deploy built from one 80-line PR has a small blast radius and an obvious revert. A deploy built from a 900-line PR that bundled four features fails in more ways and is harder to diagnose. The second is real code review. Review that gets skipped under deadline pressure, or reviewers rubber-stamping huge diffs, is where failures slip through. The third is a trustworthy pipeline. When tests are flaky, engineers learn to re-run and ignore red builds, and that habit eventually lets a real failure through. Abloomify tracks PR size, review health, and self-merge rate next to change failure rate from the same GitHub integration, so you can check whether big batches or thin review line up with your failed deploys instead of guessing.
- Cap PR size and review the largest ones first (see how to reduce PR churn)
- Fix flaky tests before they train people to ignore red builds (our piece on flaky tests covers it)
- Use feature flags so a failed change is a toggle, not a redeploy
- Track failures per repo, since one fragile service often drives most of the rate
- Read change failure rate next to MTTR, because how often you fail and how long you stay down are separate questions
When AI-Generated Code Changes Your Change Failure Rate
I switched our stack from GitHub Copilot and ChatGPT to Cursor about a year ago, and our shipping speed went up a lot. The part I watch now is whether the extra speed shows up in the failure column. More AI-written code means more code a human did not read line by line, and that can raise or lower change failure rate depending on how review adapts. I do not know which way it goes for your team, and neither does anyone else without data. Abloomify separates human and AI-agent contribution across code, PRs, and reviews, and correlates Cursor, Claude Code, and GitHub Copilot usage with output. That lets you ask a sharper question than "is AI making us faster": are the deploys with heavy AI contribution the ones that get reverted? You might find the answer is no. You might find it is yes for one team and no for another. Either way you would rather know. Our breakdown of AI code review covers the review side of the same problem.
Measure the change, not the people. Failure rates are a property of the system.
FAQ
What is change failure rate?
Change failure rate is the percentage of deployments to production that cause a failure needing a fix, rollback, or hotfix. It is one of the four DORA metrics and the main stability signal next to recovery time. Abloomify detects it automatically from failed deploys and reverts in GitHub.
How do you calculate change failure rate?
Divide the number of deploys that caused a production failure by the total number of deploys in the same period, then multiply by 100. If 4 of 36 deploys needed a rollback or hotfix, your change failure rate is about 11 percent. Agree up front on what counts as a failure.
What is a good change failure rate?
The DORA research puts elite teams at roughly 0 to 15 percent. Treat that as a compass. Compare against your own trend first, and watch it as deployment frequency rises. A stable rate while you ship more often is a better sign than a perfect rate on a team that ships monthly.
Is a 0 percent change failure rate good?
Usually it is a warning sign. A team that never fails is often shipping rarely, bundling big releases, or not recording the failures it has. Some failure is the price of shipping often. What matters is that failures are small, caught fast, and not trending up.
How is change failure rate different from MTTR?
Change failure rate says how often a deploy breaks something. MTTR says how long it takes to recover once it does. You need both. A team can fail rarely and recover slowly, or fail often and recover in minutes. Read the two together to see the full stability picture.

Amir Tavafi
Co-Founder & CEO
Product leader and innovator with over 15 years of experience in the tech sector, grounded in AI and robotics. Previously led product development in fraud detection and AI solutions at Nasdaq Verafin.