MTTR: How to Measure Mean Time to Recovery Honestly
September 29, 2026
Amir Tavafi
11 min read

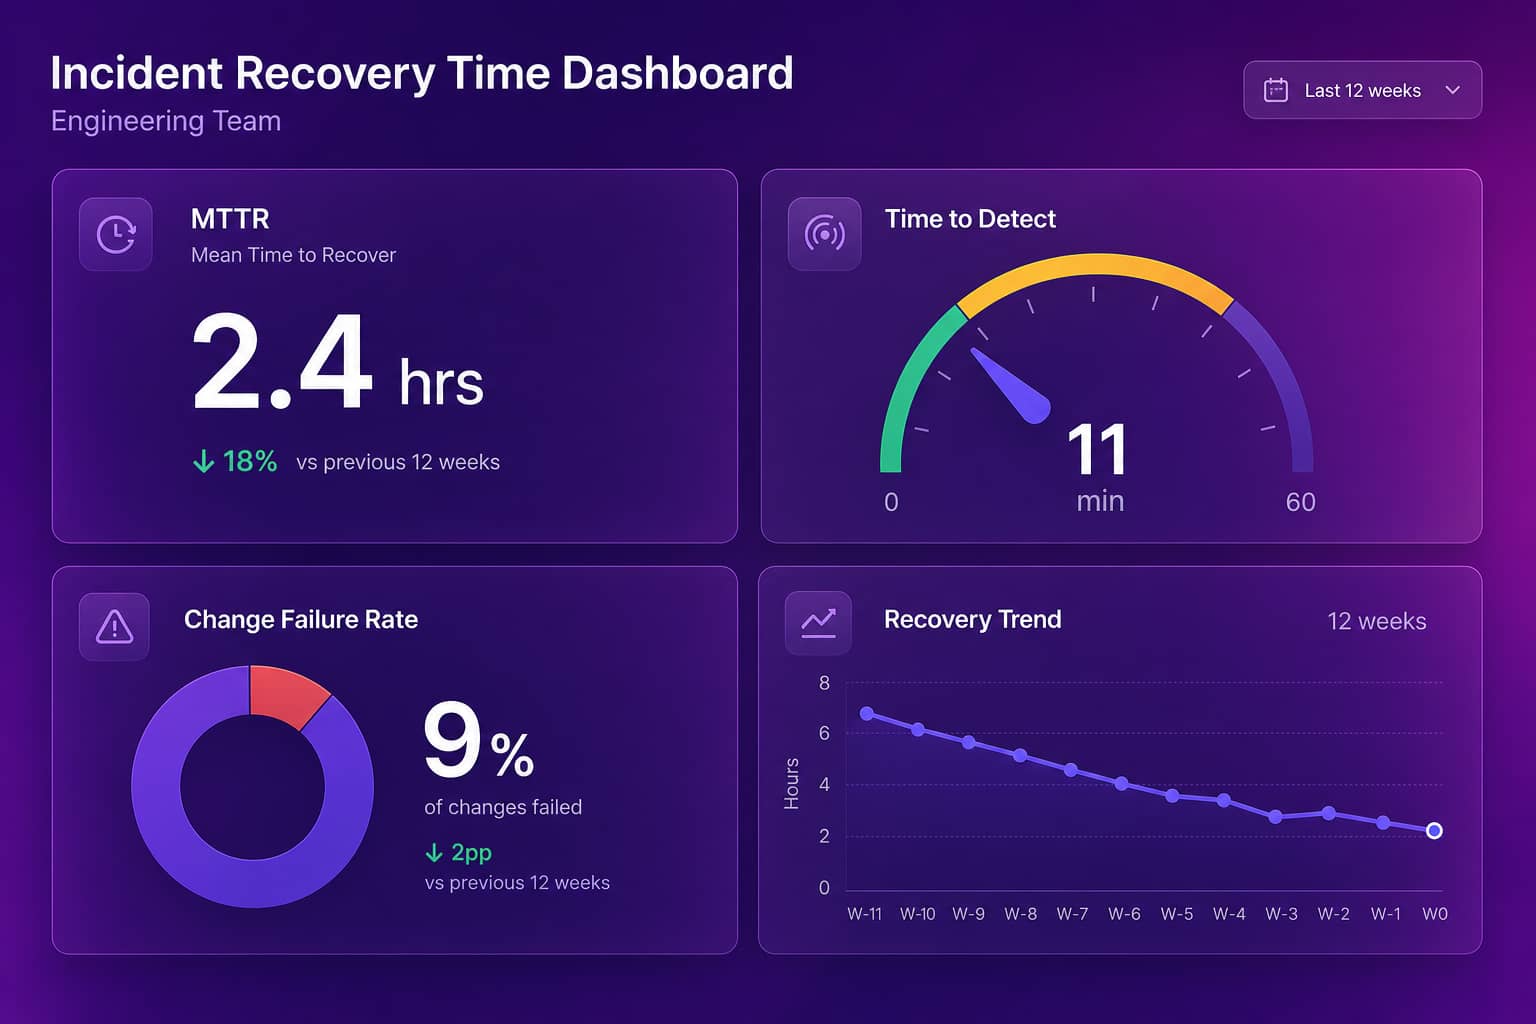
MTTR is the average time your team takes to recover after something breaks in production. It is one of the four DORA metrics, and it is the one most teams calculate wrong. Abloomify's engineering productivity analytics compute recovery time straight from GitHub deploys and reverts, so nobody has to rebuild it from a postmortem spreadsheet.
Key Takeaways
Q: What is MTTR in software engineering?
A: MTTR is mean time to recovery: the average time from the start of a production failure to the moment service is healthy again. It is one of the four DORA metrics. Abloomify computes it from GitHub and bands it Elite, High, Medium, or Low, alongside deployment frequency, lead time, and change failure rate.
Q: How do you calculate MTTR?
A: Add the recovery time of every incident in a period and divide by the incident count. Ten incidents totaling 40 hours give an MTTR of 4 hours. The real work is defining when the clock starts and stops, and applying that definition to every incident the same way.
Q: Is a lower MTTR always better?
A: Not by itself. A low MTTR can mean fast fixes, or it can mean you are logging tiny incidents and skipping the painful ones. Read it next to change failure rate. Abloomify detects change failures automatically from failed deploys and reverts, so both numbers come from the same source.
Q: What is the difference between MTTR and MTBF?
A: MTBF is how long a system runs between failures. MTTR is how long each failure takes to fix. MTBF comes from hardware and maintenance. For software that ships daily, MTTR is the more useful lever, because you will fail sometimes and the cost is how long users feel it.
Q: What actually reduces MTTR?
A: Smaller changes, fast rollbacks, and clear ownership. Teams that ship small diffs can revert a single change instead of untangling ten. Abloomify tracks PR size and review health next to recovery time, so you can see whether big batches are the reason your incidents drag.
What Is MTTR and Why Do Four Different Names Exist?
MTTR stands for mean time to recovery in most software writing, and that is the version used in the DORA research. The letters also get read as mean time to restore, mean time to resolve, and mean time to repair, and each one starts or stops the clock at a slightly different point. Mean time to repair comes from manufacturing and maintenance, where a machine is broken and a technician fixes it. Mean time to restore and mean time to recovery are close cousins that count until service works again for users. Mean time to resolve often stretches further, all the way to a finished root cause and follow-up work. The names look interchangeable and the numbers are not. A team that reports "MTTR" using the resolve definition will look much slower than a team using the restore definition, even if they run identical incident response. So the first job is not measuring. It is picking one definition and writing it on the wiki.
My pick, for what it is worth: start the clock when users are affected, stop it when service is verified healthy. Not when the ticket was opened, not when the postmortem closed. If you can only detect a failure through a customer email, that delay belongs in the number. Hiding it makes MTTR look better and your on-call life worse.
How to Calculate MTTR (With a Real Example)
To calculate MTTR, add up the recovery time of every incident in a period and divide by the number of incidents. That is the whole formula. If your team had six production incidents last quarter and the recovery times were 20 minutes, 35 minutes, 1 hour, 1 hour 40 minutes, 2 hours, and 14 hours, the total is 19 hours 35 minutes across six incidents, so your MTTR is about 3 hours 16 minutes. Simple arithmetic, and already misleading, because five of those six incidents recovered in two hours or less. The one 14-hour incident is doing most of the work in the average. This is why the formula is the easy part. The judgment is in three choices: when the clock starts, when it stops, and which events count as an incident at all. Write those three choices down before you calculate anything, apply them to every incident in the window, and do not change them halfway through the year or your trend line becomes fiction.
| Choice | Option A | Option B | What I would pick |
|---|---|---|---|
| Clock starts | First alert fires | Users first affected | Users first affected |
| Clock stops | Fix is deployed | Service verified healthy | Service verified healthy |
| What counts | Pages only | Any customer-visible degradation | Any customer-visible degradation |
Why Average MTTR Lies and What to Track Next to It
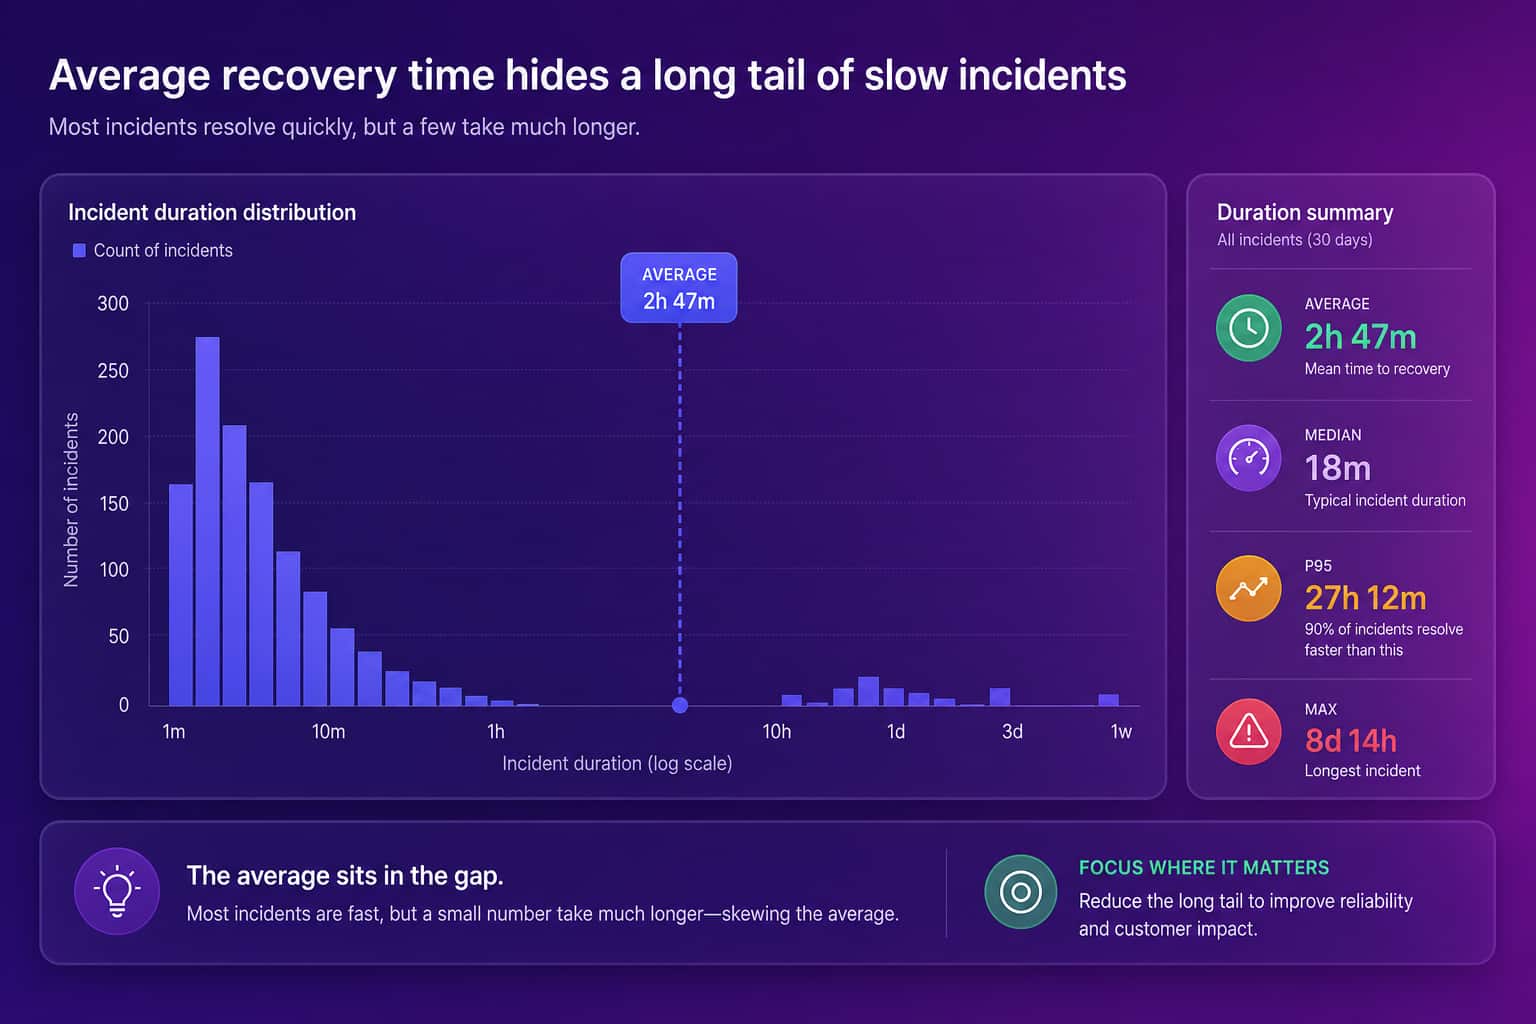
Average MTTR lies because recovery times are not evenly spread. Most incidents are small and get fixed quickly, and a few are large and take days. The mean lands in the gap between the two groups, in a place where almost no real incident lives. In the example above, the 3 hour 16 minute MTTR describes none of the six incidents. A leader reading that number would conclude the team needs to speed up every fix by a bit, when the actual problem is one category of failure that nobody knows how to roll back. So track three things next to the mean. Track the median, which shows what a normal incident looks like. Track the slowest incident in the window, which shows your real worst case. And track change failure rate, because MTTR tells you how bad each failure is while change failure rate tells you how often you have one. A team with a fast MTTR and a 40% change failure rate is not healthy. It is just very practiced at cleaning up.
The DORA research bands recovery time from Elite to Low, and I would treat the bands as a compass, not a target. Abloomify computes all four DORA metrics straight from GitHub, each banded Elite to Low, with automatic change-failure detection from failed deploys and reverts. That means the failure count and the recovery clock come from the same source, instead of from a spreadsheet somebody updates after the postmortem. If you want the fuller picture of the other three, our guide to DORA metrics covers them.
MTTR vs MTBF: Which One Should a Software Team Track?
MTBF, mean time between failures, measures how long a system runs before it breaks, and MTTR measures how long it takes to get back up once it does. The two metrics come from different worlds. MTBF grew up in hardware and maintenance, where a pump or a server has a lifespan and failures are mostly about wear. In that world, the goal is to fail less often, so MTBF is the number to watch. Software behaves differently. You ship changes many times a week, every change is a small bet, and some bets lose. Chasing a huge MTBF in that setting means shipping less, which is the opposite of what the business wants. So most software teams give MTBF a supporting role and put MTTR next to change failure rate at the center. Fail sometimes, recover fast, and keep each change small enough that recovery is a revert, not an investigation. If you run physical infrastructure or on-prem hardware, keep MTBF too. For the code you deploy, MTTR is the one that changes behavior.
What Actually Reduces MTTR?
Three things reduce MTTR, and none of them is a dashboard. The first is smaller changes. When a deploy is one 80-line PR, recovery is a revert and a redeploy. When it is a 900-line PR that bundled four features, recovery starts with figuring out which part broke, and that investigation is where the hours go. The second is a rollback path that someone has actually used. Plenty of teams have one on paper and discover at 2am that it does not work. Practice it. The third is clear ownership: who gets paged, who decides to roll back, who talks to customers. Recovery time is mostly coordination time. Plenty of incidents lose their first hour to nothing more than working out who is allowed to say yes to a rollback. Abloomify tracks PR size, review health, and self-merge rate next to recovery time from the same GitHub integration, so you can see whether large batches are the reason your incidents drag instead of guessing.
- Ship smaller diffs so a revert undoes exactly one change
- Rehearse the rollback quarterly, on a real service, with a timer running
- Write down who can approve a rollback without asking anyone else
- Add flaky tests to the fix list, since a red pipeline slows every recovery (our piece on flaky tests covers why)
- Review the slowest incident of the month, not the average one
When AI-Generated Code Changes Your Recovery Time
I switched our stack from GitHub Copilot and ChatGPT to Cursor about a year ago, and our shipping speed went up a lot. What went up with it was the volume of code that a human had not read line by line. That matters for MTTR because recovery starts with understanding, and understanding a failure in code that nobody on the team wrote by hand takes longer. It is not a reason to drop AI tools. It is a reason to measure them. Abloomify separates human and AI-agent contribution across code, PRs, and reviews, and correlates Cursor, Claude Code, and GitHub Copilot usage with output. That lets you ask a sharper question than "is AI making us faster": are the PRs with heavy AI contribution the ones that show up in your incident list, and do they take longer to recover from? You may find the answer is no. You may find it is yes for one team and no for another. Either way you would rather know than guess. Our breakdown of AI code review covers the review side of the same problem.
FAQ
What does MTTR stand for?
In software, MTTR usually means mean time to recovery: the average time from the start of a failure to the moment service is restored. You will also see mean time to restore, mean time to resolve, and mean time to repair. They sound alike but start and stop the clock at different points, so pick one definition and write it down.
How do you calculate MTTR?
Add up the recovery time of every incident in a period, then divide by the number of incidents. Ten incidents that took 40 hours in total give an MTTR of 4 hours. The hard part is agreeing when the clock starts (detection or customer impact) and when it stops (fix deployed or service verified healthy).
What is the difference between MTTR and MTBF?
MTBF, mean time between failures, measures how long a system runs before it breaks. MTTR measures how long it takes to get back up once it does. MTBF describes how often you fail. MTTR describes how bad each failure is. Modern software teams usually push on MTTR because shipping fast means failing sometimes.
What is a good MTTR?
The DORA research bands recovery time from Elite to Low, and Elite teams recover in under an hour. Abloomify computes recovery time straight from GitHub and bands it the same way. Compare against your own trend first. A team that goes from 9 hours to 3 hours has improved more than the label suggests.
Why is MTTR a misleading metric on its own?
An average hides the long tail. Nine incidents fixed in 20 minutes and one that takes two days produce an MTTR that describes none of them. Track the median and the slowest incidents next to the mean, and read MTTR together with change failure rate so you know how often you are recovering, not only how fast.

Amir Tavafi
Co-Founder & CEO
Product leader and innovator with over 15 years of experience in the tech sector, grounded in AI and robotics. Previously led product development in fraud detection and AI solutions at Nasdaq Verafin.