Top 8 Tools to Measure AI Adoption and Prove ROI in 2026
October 19, 2025
Walter Write
13 min read

Key Takeaways
Q: Why do most AI initiatives struggle to show measurable ROI?
A: Because the seats get bought before anything is instrumented. Without a pre-rollout baseline for delivery speed, review health, and cost per team, there is no way to separate what the tool did from what a good quarter did.
A: Because the seats get bought before anything is instrumented. Without a pre-rollout baseline for delivery speed, review health, and cost per team, there is no way to separate what the tool did from what a good quarter did.
Q: What should leaders track to prove AI ROI?
A: Four things. Real adoption (which seats are active, how often, on what kind of work). Delivery output (PR cycle time, throughput, rework and defect rates). Cost (license spend plus AI credit spend, broken out by source). And the split between human and AI agent contribution across tasks, code, PRs, and reviews.
A: Four things. Real adoption (which seats are active, how often, on what kind of work). Delivery output (PR cycle time, throughput, rework and defect rates). Cost (license spend plus AI credit spend, broken out by source). And the split between human and AI agent contribution across tasks, code, PRs, and reviews.
Q: How long before AI ROI shows up in the numbers?
A: Adoption and time-saved signals appear within four to eight weeks. Delivery metrics move slower, usually one to two quarters, and only if you captured a baseline before the rollout. Reconstructing a baseline afterward is guesswork with a chart on it.
A: Adoption and time-saved signals appear within four to eight weeks. Delivery metrics move slower, usually one to two quarters, and only if you captured a baseline before the rollout. Reconstructing a baseline afterward is guesswork with a chart on it.
Q: Can AI adoption be measured without invasive monitoring?
A: Yes. Privacy-first platforms read the work systems you already run (code repositories, ticket systems, calendars) and use PII-free device signals for app-level usage. No screenshots, no keyloggers, no screen recording, no content capture.
A: Yes. Privacy-first platforms read the work systems you already run (code repositories, ticket systems, calendars) and use PII-free device signals for app-level usage. No screenshots, no keyloggers, no screen recording, no content capture.
Most AI budgets get approved on a story and renewed on a hunch. Someone demos Cursor, the team feels faster, finance signs the invoice, and a year later nobody can say what actually changed.
The gap is not interest. It is measurement. AI usage spreads across IDE plugins, browser tabs, personal subscriptions, and features embedded inside tools you already pay for, and almost none of that lands in a system that also knows what your team shipped. The eight platforms below each close some part of that gap. They are not equally good at it, and I will say which is which.
Why is measuring AI ROI so hard?
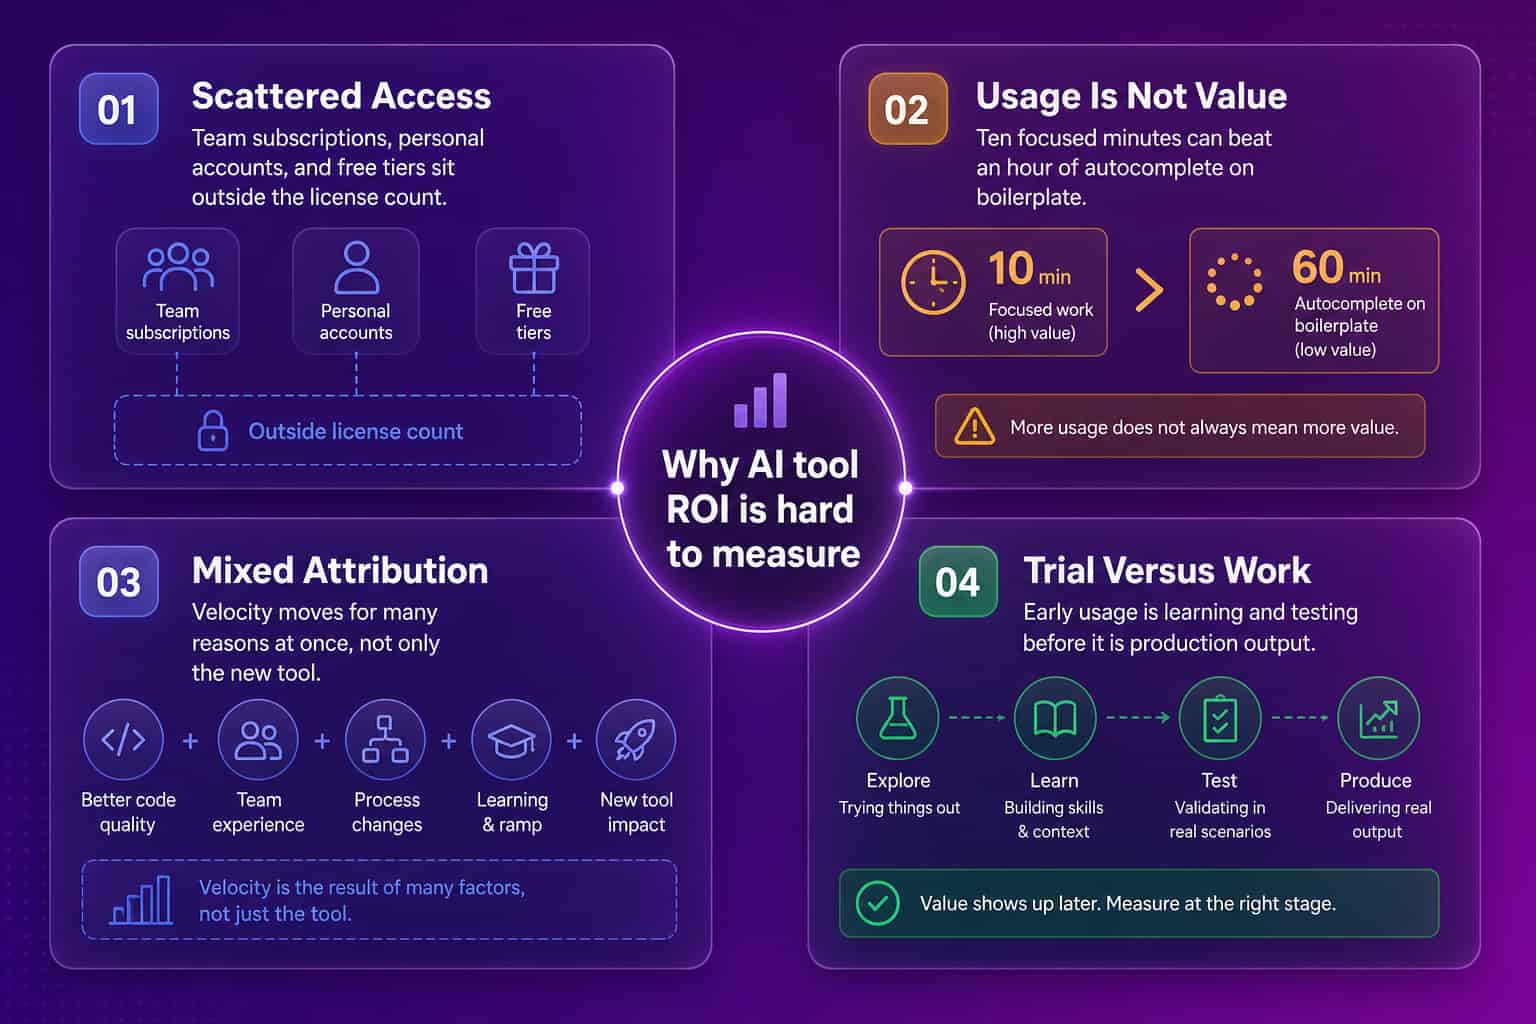
Traditional software is easy to score. Seats, logins, feature usage, and a clear output on the other side. AI tools break that model in four specific ways.
Access is scattered
ChatGPT, Claude, and Copilot reach your team through org subscriptions, personal accounts quietly expensed, free tiers, and features bundled into software you already own. Your license count is not your usage count, and the gap runs in both directions.
Usage time is a weak proxy
An engineer who spends ten minutes putting Claude Code on a gnarly refactor may create more value than someone running autocomplete for an hour on boilerplate. Hours used tells you almost nothing about value created.
Attribution is genuinely messy
Velocity improves after a rollout. Was it the tool, a lighter backlog, a new tech lead, or the two contractors who finally ramped? Anyone offering you a clean causal read on a single quarter is selling something.
Early usage is mostly learning
The first six weeks after an AI rollout are experimentation. Count that as production output and you inflate your own baseline, which makes month three look like a regression when it is just people settling in.
What makes an AI measurement platform actually useful?
Four capabilities separate a platform that proves ROI from one that draws charts.
The first is coverage across systems. AI usage lives in the IDE, delivery outcomes live in GitHub and Jira, and cost lives in a billing console. A platform that only sees one of those cannot connect them, no matter how good the visualization is.
Second, it needs to distinguish how a tool gets used, not just how long. Boilerplate generation and architectural work both register as "Copilot usage" in a raw activity log, and they have almost nothing to do with each other.
Third, the usage data has to correlate with outcomes your finance team already tracks: cycle time, throughput, defect rates, license spend. If a platform invents its own proprietary score and stops there, you will spend the exec meeting defending the score instead of making the decision.
The fourth one is the one buyers skip. All of that has to happen without surveillance. There is no evidence that monitoring improves performance (a Personnel Psychology meta-analysis found none), and 2026 survey research found about 1 in 6 workers would quit over workplace surveillance. Instrumenting an AI rollout with a screenshot tool is an efficient way to lose the engineers you were trying to make faster.
| Metric category | Example metrics | Why it matters |
|---|---|---|
| Adoption | Active users, sessions/user/week, feature usage | Shows real usage vs. licenses purchased |
| Productivity | Cycle time, PR throughput, tasks/week | Connects AI to delivery speed |
| Quality | Defect rate, rework %, customer CSAT | Ensures speed gains don’t harm quality |
| Business | Revenue impact, time saved to dollar value | Translates benefits into ROI |
1. Abloomify
We build this one, so weight the section accordingly.
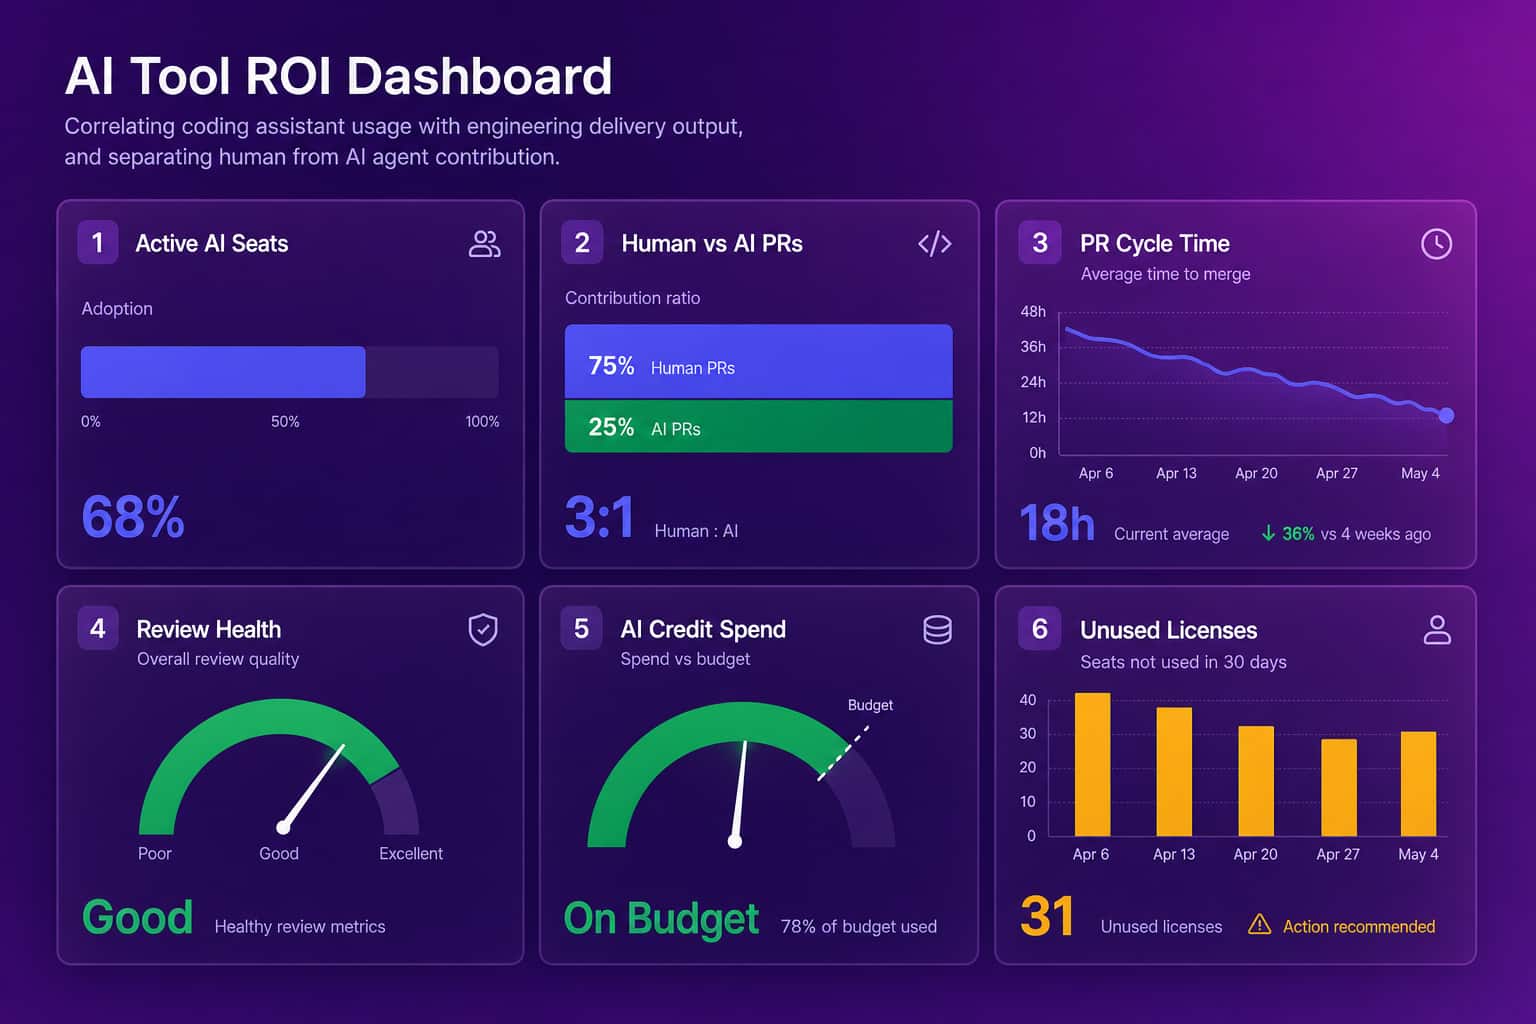
Abloomify is a privacy-first workforce intelligence platform. On the AI ROI question specifically, it imports usage from Cursor, Claude Code, and GitHub Copilot, correlates it with what engineering actually shipped, and separates human from AI agent contribution across tasks, code, PRs, and reviews.
What that gets you in practice:
- AI coding tool usage per tool and per team, sitting next to PR throughput, cycle time, and review health rather than in a separate console
- A human vs AI agent contribution split on real work, so "AI wrote most of that" stops being a hallway opinion
- AI-vs-human cohort comparison: do the heavy adopters actually ship more and review faster, or do they just merge faster?
- AI usage and cost governance, with credit usage broken out by source (live chat, scheduled runs, email assistant) and company budget guards on automated runs
- All four DORA metrics computed from GitHub, plus CI/CD health and security posture in the same platform
The privacy model is the part that decides whether this survives contact with your engineering team. Abloomify pulls PII-free signals through 100+ API integrations: no email content, no message content, no file content. The Mac and Windows device agents collect aggregated usage by application category. No screenshots, no keyloggers, no screen recording, no content capture. SOC 2 Type II, with hosting in North America or the EU, and device rollout through any MDM (Intune, Jamf, Rippling, Kandji, and more).
Bloomy is the AI layer on top. It answers questions over connected data, and since mid-2026 it also runs on a schedule: Bloomy Tasks executes recurring runs over your connected systems, emails a decision-ready report, and leaves a resumable conversation you can keep interrogating from the email. Dashboards you check. Bloomy checks in on you.
If the internal objection is "we already use ChatGPT and Claude," External AI Access is the answer. Abloomify's MCP server connects those tools to company knowledge, scoped to exactly what each person is already permitted to see, revocable instantly. The assistants your team already likes keep working, they just stop answering from a blank slate.
Pricing is $9 per seat per month billed annually, free up to 5 users. See how Abloomify measures engineering and AI tool ROI, or request a demo on your own data.
2. GitHub Copilot Metrics
If Copilot is your entire AI footprint, GitHub's own Copilot metrics and Insights views are the cheapest place to start. Suggestion acceptance rates, generated line counts, per-org adoption trends, straight from the source with no extra vendor in the loop.
The ceiling is low. Acceptance rate is a usage metric wearing an outcome metric's clothes, since a developer can accept a suggestion and rewrite it three minutes later. It sees nothing from Cursor, Claude Code, or ChatGPT, and it does not connect to delivery outcomes at all. Treat it as one input. We wrote up how to read these numbers without fooling yourself in GitHub Copilot metrics.
3. Plandek
Engineering delivery analytics with strong sprint performance and flow metrics, plus wide toolchain coverage. That makes it a reasonable instrument for a before-and-after comparison, provided you set the baseline before the AI rollout rather than after. AI measurement is not its job, though, so linking tool usage to the metrics Plandek produces stays manual work you do in a spreadsheet.
4. LinearB
The delivery layer is where LinearB is genuinely strong: cycle time, PR size, review latency, and workflow automation sitting on top of the metrics. If your ROI story is "our PRs move faster," LinearB tells that story well and the charts survive an exec meeting.
It does not track AI tool usage directly, so the causal link stays inferred. Good enough for an engineering leader who already believes. Thin for a CFO who wants spend tied to output.
5. Opsera
DevOps intelligence organized around pipeline health and DORA metrics. Useful when your AI investment is aimed squarely at delivery throughput and you already run mature CI/CD, because the metrics it produces are the ones that should move. The measurement is indirect by design: you watch deployment frequency and change failure rate shift, then argue about why. A clean pre-rollout baseline matters here more than anywhere else on this list.
6. Jellyfish
Resource allocation and engineering business intelligence. Its strength is answering "where did the engineering hours actually go," which is a useful frame for an AI ROI conversation with a CFO who thinks in cost centers rather than cycle time. Direct AI tool usage tracking is limited, and the allocation models need scrutiny before anyone starts quoting them as fact.
7. Waydev
Granular developer and team analytics, including code quality signals. It will show you that patterns changed after a rollout, but whether the change was Copilot or the new tech lead is still your argument to make.
One caution worth naming: that individual-level granularity is easy to misuse. Push it out to managers without context and you create the trust problem the privacy-first approach exists to avoid.
8. Uplevel
Focused on developer experience, so focus time, meeting load, and collaboration patterns. A good complement rather than a primary AI ROI tool.
If your AI thesis is "we gave people their afternoons back," Uplevel measures the afternoons well. It does not measure the AI.
Direct measurement or outcome correlation?
Two approaches, and most buyers pick one when they should run both.
Direct tracking watches AI tool engagement through integrations or a device agent. It gives you adoption numbers you can act on this week: who never activated, which teams stalled at week three, where enablement is actually needed. The cost is deployment effort, and it is the moment employees decide whether they trust the program.
Outcome correlation watches delivery metrics and attributes movement to the rollout based on timing. It gives you numbers executives already care about without touching anyone's machine. It also cannot prove causation, lags by weeks or months, and hides adoption failures until the outcomes are already bad.
Direct tracking tells you whether the rollout is happening. Outcome metrics tell you whether it mattered. You need both answers, and they arrive on different schedules.
| Dimension | Direct measurement | Outcome correlation |
|---|---|---|
| Timing | Immediate adoption signal | Lagging business results |
| Coverage | Tool-level engagement | Team/project outcomes |
| Causality | Strong usage attribution | Correlation, not causation |
| Setup effort | Integrations/agents | Works with existing KPIs |
| Best use | Adoption health; enablement | Executive ROI proof |
How should you choose?
Pick based on which conversation you have to win.
If the audience is your CFO or your board, you need one system that spans every AI tool you pay for and connects spend to output. That is the case for Abloomify: multiple tools under unified measurement, cost governance on AI credit usage, and a privacy model you can present to the whole company without a difficult all-hands. It is also the right pick if the AI question is only part of a broader visibility problem, since the same platform covers capacity, workload balance, and burnout signals. Some teams get there by replacing a monitoring tool first, which is why our alternatives page exists.
If the audience is your own engineering org and Copilot is the whole AI footprint, GitHub's native metrics plus LinearB or Plandek will get you most of the way for less money and far less change management. Buying a workforce intelligence platform to answer one narrow question about one tool is overkill, and I would rather tell you that now than in month four of a pilot.
Five questions worth asking every vendor on the call:
- Does it see every AI tool we pay for, or only one of them?
- Can it separate human from AI agent contribution on real work, or does it stop at usage counts?
- Does it capture screen content in any form? Ask directly, and ask what is merely optional versus impossible.
- Where does our data live, and can we choose the region?
- What arrives without anyone logging in?
That last question gets underrated. A dashboard nobody opens is just a line item on the invoice.
Where to start
Capture the baseline before you scale the rollout. That is most of the trick. Record PR cycle time, throughput, review health, and delivery frequency for the eight weeks before the tool lands, then measure the same things after. Skip this and every ROI number you produce later is a story with a chart attached to it.
Then write down what "worked" means before you find out. For most teams the honest answer turns out to be mixed: cycle time drops on well-scoped work, the genuinely hard problems take exactly as long as they used to, and the license bill is carrying seats nobody ever activated. That mixed result is still a good outcome, because now you can act on it. The range we work with for mid-market companies is $500K to $2M a year in hidden workforce waste and $50K to $100K in redundant SaaS licenses, and AI seats are joining that pile fast.
If you want to see your own AI usage sitting next to your delivery data, request a demo. If you are earlier than that and still deciding which coding tools to standardize on, start with our breakdown of agentic AI coding tools.
AI spend deserves the same scrutiny as a headcount request. Most companies are still approving it like a snack budget.

Walter Write
Staff Writer
Tech industry analyst and content strategist specializing in AI, productivity management, and workplace innovation. Passionate about helping organizations leverage technology for better team performance.