How to Calculate Turnover Rates (and What the Number Hides)
August 26, 2026
Amir Tavafi
10 min read

If you Google "how to calculate turnover rate," you'll get the formula in the first ten seconds and a false sense of security in the next ten minutes. The math is simple: separations divided by average headcount, times 100. What that single number does with the real story of who left and why is the part most guides skip.
Key Takeaways
Q: What's the exact formula for employee turnover rate?
A: Turnover rate = (separations ÷ average headcount) × 100. If 18 people left a 240-person company over a year with an average headcount of 220, turnover is 18 ÷ 220 × 100, or about 8.2%. Calculate voluntary and involuntary separately if you want a number that means something.
Q: What's the formula for retention rate?
A: Retention rate = 100 minus turnover rate for the same period. An 8.2% turnover rate means 91.8% retention. They're two views of the same headcount math, not two separate calculations you need to run independently.
Q: Is 10% turnover rate good or bad?
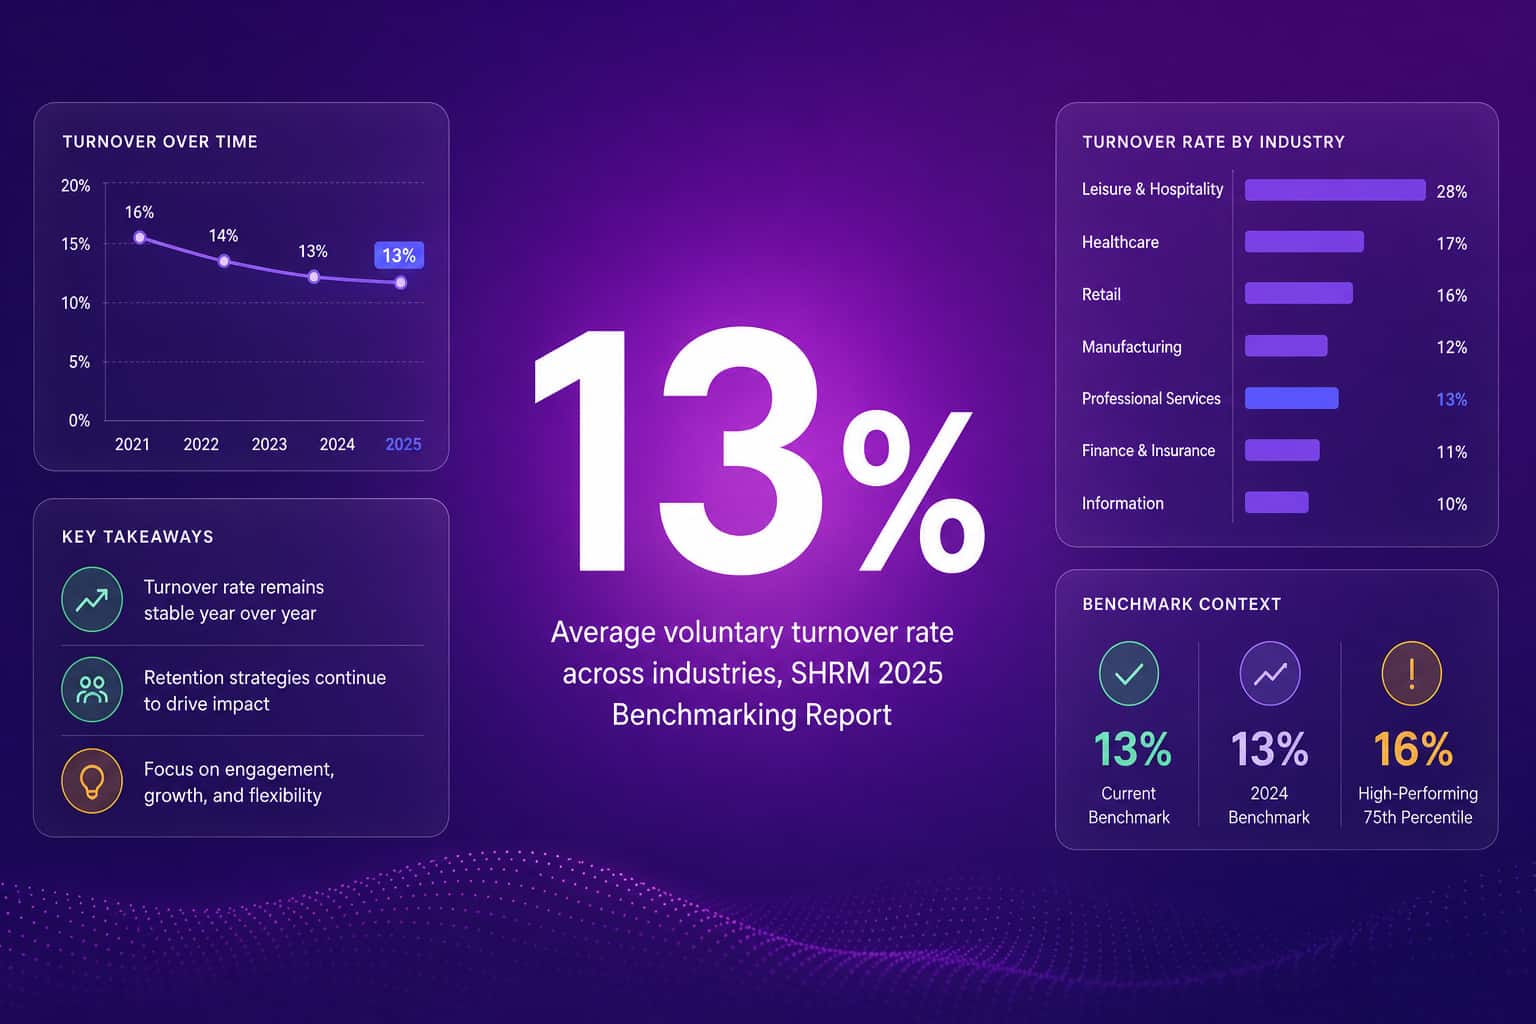
A: For most tech and SaaS companies, under 10% voluntary turnover is solid. SHRM's 2025 Benchmarking Report puts the median at 9-12% and the average at 13%, so 10% sits right around the healthy middle of the market, not an outlier in either direction.
Q: Why can a "good" turnover rate still mean a retention problem?
A: Because the formula counts every departure the same. A company that loses 10 average performers and replaces them easily looks identical, on paper, to one that loses its 3 best engineers and 7 people nobody will miss. Abloomify tracks flight-risk signals by person, not just the aggregate rate, so you see which kind of turnover you actually have.
What Is Employee Turnover Rate?
Employee turnover rate is the percentage of your workforce that left during a given period, calculated against your average headcount for that same period. It's the single most requested HR metric in board decks and the one most often reported without the context that makes it useful: whether the departures were voluntary or involuntary, concentrated in one team or spread evenly, and whether the people leaving were your strongest performers or your weakest. Total turnover blends resignations, terminations, retirements, and layoffs into one figure. Most operators actually care about voluntary turnover (people who chose to leave), because that's the number that tells you something about your culture, pay, management, and workload, rather than about a reduction-in-force decision you made on purpose.
There are three versions of this number worth knowing apart. Total turnover counts every separation, voluntary or not. Voluntary turnover counts only resignations, the number most people mean when they say "our turnover rate." Involuntary turnover counts terminations, layoffs, and non-renewals. If your total turnover looks high but your involuntary number explains most of it because you did a planned restructuring, that's a very different conversation with your board than if voluntary turnover alone is climbing.
How to Calculate Turnover Rate: Formula and Worked Example
Calculating turnover rate takes three inputs: your headcount at the start of the period, your headcount at the end, and the number of people who separated during it. Average headcount is (starting headcount + ending headcount) ÷ 2. Separations is a straight count of departures in that window, and you should decide before you calculate whether that means voluntary only, involuntary only, or both, because reporting a blended number without saying so is how people get surprised in the board meeting.
Here's the formula, then a worked example:
Turnover Rate (%) = (Separations ÷ Average Headcount) × 100
Say your company started the year with 210 employees and ended with 230. Average headcount is (210 + 230) ÷ 2 = 220. Over the year, 22 people resigned voluntarily and 4 more were let go in a small restructuring, for 26 total separations.
- Voluntary turnover: 22 ÷ 220 × 100 = 10%
- Involuntary turnover: 4 ÷ 220 × 100 = 1.8%
- Total turnover: 26 ÷ 220 × 100 = 11.8%
Report all three if you're presenting to leadership. A single blended 11.8% figure invites the wrong question ("why is turnover so high?") when the real story is a normal 10% voluntary rate plus a planned headcount adjustment.
How to Calculate Employee Retention Rate
Retention rate answers the inverse question: what percentage of your workforce stayed for the period you're measuring. It uses the same two inputs as turnover rate, just flipped, and it's the number most boards actually want to see trending upward rather than the turnover number trending downward, even though they're mathematically the same fact stated two ways.
Retention Rate (%) = ((Average Headcount − Separations) ÷ Average Headcount) × 100
Using the example above: (220 − 26) ÷ 220 × 100 = 88.2% total retention, or equivalently, 100 − 11.8%. If you only track voluntary separations, retention against voluntary turnover alone is 100 − 10% = 90%. Both numbers are correct; they're just answering slightly different questions, so label your chart clearly. A retention rate quoted without saying whether it's "voluntary only" or "total" is the same ambiguity problem as turnover rate, just wearing a more optimistic-sounding number.
One planning note: retention rate calculated over a full year tends to look better than the same workforce measured in rolling quarters, because a person who leaves in month 2 and gets replaced by month 4 still counts as one separation against the full-year average headcount. If you're comparing your number to a competitor's or an industry benchmark, confirm they're using the same measurement window you are.
What's a Good Turnover Rate in 2026?
There's no universal "good" turnover rate because it depends heavily on industry, company stage, and whether you're measuring voluntary or total separations, but the closest thing to an industry-wide answer comes from SHRM's 2025 Benchmarking Report, which surveyed over 2,300 organizations and found median voluntary turnover of 9-12% with an average of 13%, the gap explained by a smaller cohort of very high-churn organizations pulling the mean upward. Mercer's 2025 US Turnover Survey of more than 2,600 organizations landed in the same range, at roughly 13% voluntary turnover annually. For a tech or SaaS company specifically, anything under 10% voluntary is generally considered healthy; above 20% is worth investigating at the team level rather than the company level, because company-wide averages routinely hide one or two departments in real trouble.
Benchmarks like these are a sanity check, not a target. A company at 8% turnover that's quietly losing its highest performers is in worse shape than a company at 15% turnover that's mostly cycling through underperformers who weren't a fit. The rate tells you scale. It doesn't tell you who.
Why the Formula Hides the Real Problem
Here's the part most turnover guides skip entirely: the formula treats every departure as interchangeable, and that's exactly where it stops being useful for making decisions. HR teams call this the difference between regretted and unregretted attrition, regretted being the departures you'd have paid to prevent, unregretted being the ones you were quietly fine with. A blended turnover rate can't distinguish between them, which means two companies with identical 10% turnover rates can be in completely different positions. One lost ten people it was happy to replace. The other lost its three strongest engineers and seven people who weren't pulling weight, and the rate looks the same either way.
This is also why turnover rate alone can't tell you about capacity risk, only headcount risk. A team that's down two people but was overstaffed to begin with is in a different position than a team that's down two people and was already stretched thin. You need to know who left, what they were carrying, and whether the people at risk of leaving next are the ones you can least afford to lose.
How to Actually Lower Turnover Rate Once You Know the Number
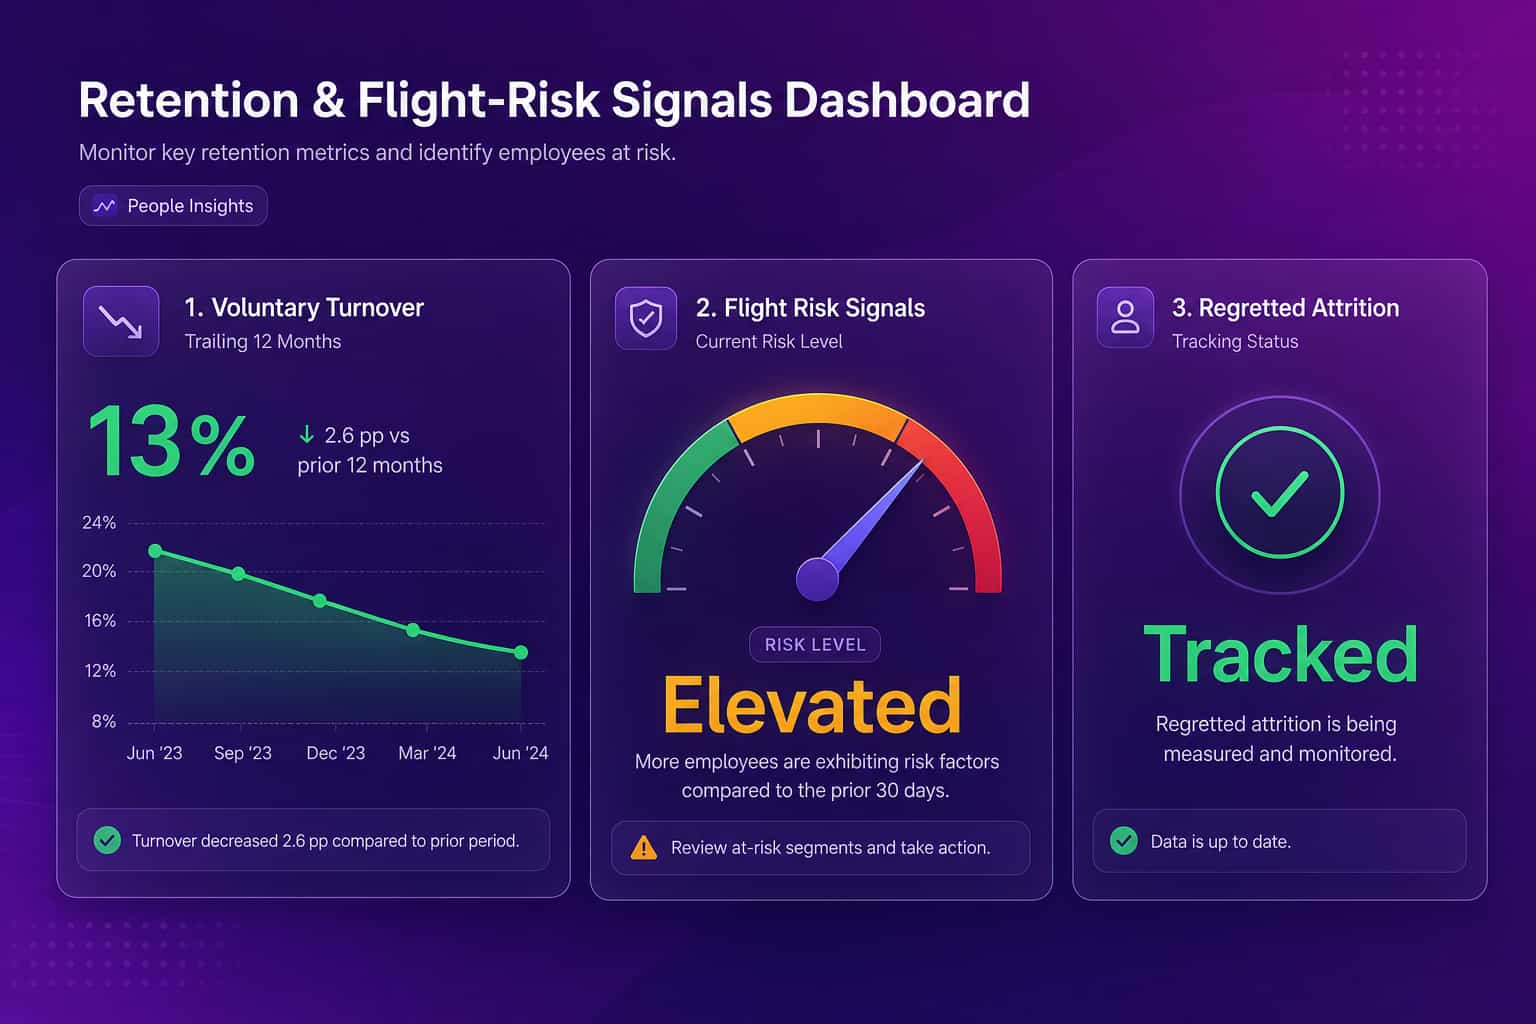
Calculating the rate is step one. Doing something about it means finding the signals that show up before someone resigns, not after. Abloomify's AI People Manager reads work patterns, collaboration signals, and workload data (privacy-first, PII-free, no screenshots or keyloggers) to flag flight-risk and disengagement patterns as much as 60+ days before an exit interview would tell you the same thing. Customers using it have cut turnover by 62%, and cut the time spent drafting performance reviews by 75%, because the evidence is already assembled instead of pieced together from memory the week reviews are due.
The practical sequence looks like this: calculate voluntary and involuntary turnover separately so you know what you're actually solving for, break the rate down by team or manager so you can see where it's concentrated, layer in who is leaving (regretted vs. not) instead of just how many, and then watch for the early signals, capacity overload, disengagement, stalled career progression, that predict the next departure instead of waiting to count it. A single company-wide percentage will always be a lagging indicator. Flight-risk detection is the leading one.
If you're trying to put a number on what each departure actually costs before you decide where to focus, our employee turnover cost calculator breaks down replacement, ramp, and hidden costs so the business case for fixing this writes itself. And if you want to run the turnover and retention math on your own headcount numbers right now, the free turnover rate calculator does the arithmetic in this article for you.
FAQ
What is the formula to calculate turnover rate?
Turnover rate = (number of separations during a period ÷ average headcount during that period) × 100. Average headcount is usually (starting headcount + ending headcount) ÷ 2. Decide upfront whether "separations" means voluntary only, involuntary only, or both, and calculate them separately if you want a number you can act on.
What is the formula to calculate retention rate?
Retention rate = ((average headcount − separations) ÷ average headcount) × 100, or more simply, 100 minus your turnover rate. If turnover for the period is 9%, retention is 91%. The two numbers always sum to 100% for the same period and headcount base.
What counts as a good turnover rate in 2026?
SHRM's 2025 Benchmarking Report puts median voluntary turnover at 9-12% and the average at 13% across industries, pulled up by a smaller group of high-churn organizations. Below 10% voluntary is generally healthy for a tech or SaaS company; above 20% deserves a look at who is actually leaving, not just how many.
Should I calculate turnover rate monthly, quarterly, or annually?
Track it monthly so you catch spikes early, but report it annually (or annualized) since that is the number leaders and boards compare against benchmarks. A single bad month can look alarming in isolation and unremarkable once annualized, so show both when you present it.
Does turnover rate tell you if you have a real retention problem?
Not by itself. A 9% blended turnover rate can hide a division where three of your five best engineers left, because the formula treats every departure as identical. Abloomify's AI People Manager flags flight-risk and disengagement signals from actual work patterns, months before an exit interview would tell you the same thing.

Amir Tavafi
Co-Founder & CEO
Product leader and innovator with over 15 years of experience in the tech sector, grounded in AI and robotics. Previously led product development in fraud detection and AI solutions at Nasdaq Verafin.