Workforce Utilization Rate: How to Measure It Right (2026)
May 21, 2026
Amir Tavafi
12 min read

Workforce utilization rate is the share of available work hours that turn into productive output, and most tech companies measure it wrong. They borrow a billable-hours formula from consulting, chase a number near 100%, and end up hiding both waste and burnout in the same metric. At Abloomify, across three customers and a few hundred operator conversations, the leaders who use utilization well treat it as a capacity signal, not a scoreboard.
Key Takeaways
Q: What is workforce utilization rate?
A: Workforce utilization rate is the percentage of a team's available hours spent on productive or billable work, calculated as productive hours divided by available hours times 100. For tech companies it signals where capacity is wasted or stretched, and Abloomify tracks it across 100+ connected tools without surveillance.
Q: How do you calculate utilization rate?
A: Divide productive (or billable) hours by total available hours, then multiply by 100. A developer with 32 productive hours out of 40 available runs at 80%. The hard part is not the formula, it is getting honest hours without resorting to timesheets or screenshots.
Q: What is a good workforce utilization rate?
A: There is no universal number. Billable consulting chases a high band, but product engineering needs slack for code review, learning, and on-call. Push sustained utilization toward 100% and you usually buy short-term output against burnout risk, which Abloomify can flag 60+ days early.
Q: Why does utilization rate mislead tech teams?
A: Because the billable-hours model assumes every productive hour looks the same. In engineering, an hour shipping a feature and an hour stuck in a stale review both count, so a high utilization rate can hide a slow delivery system. Capacity, not activity, is the real signal.
Q: Can you measure utilization rate without monitoring software?
A: Yes. Abloomify reads PII-free signals from Jira, GitHub, Google Workspace, and M365 plus optional aggregated device metrics, with no screenshots or keyloggers. A Personnel Psychology meta-analysis found no evidence that monitoring improves performance, and 1 in 6 workers would quit over surveillance.
What is workforce utilization rate?
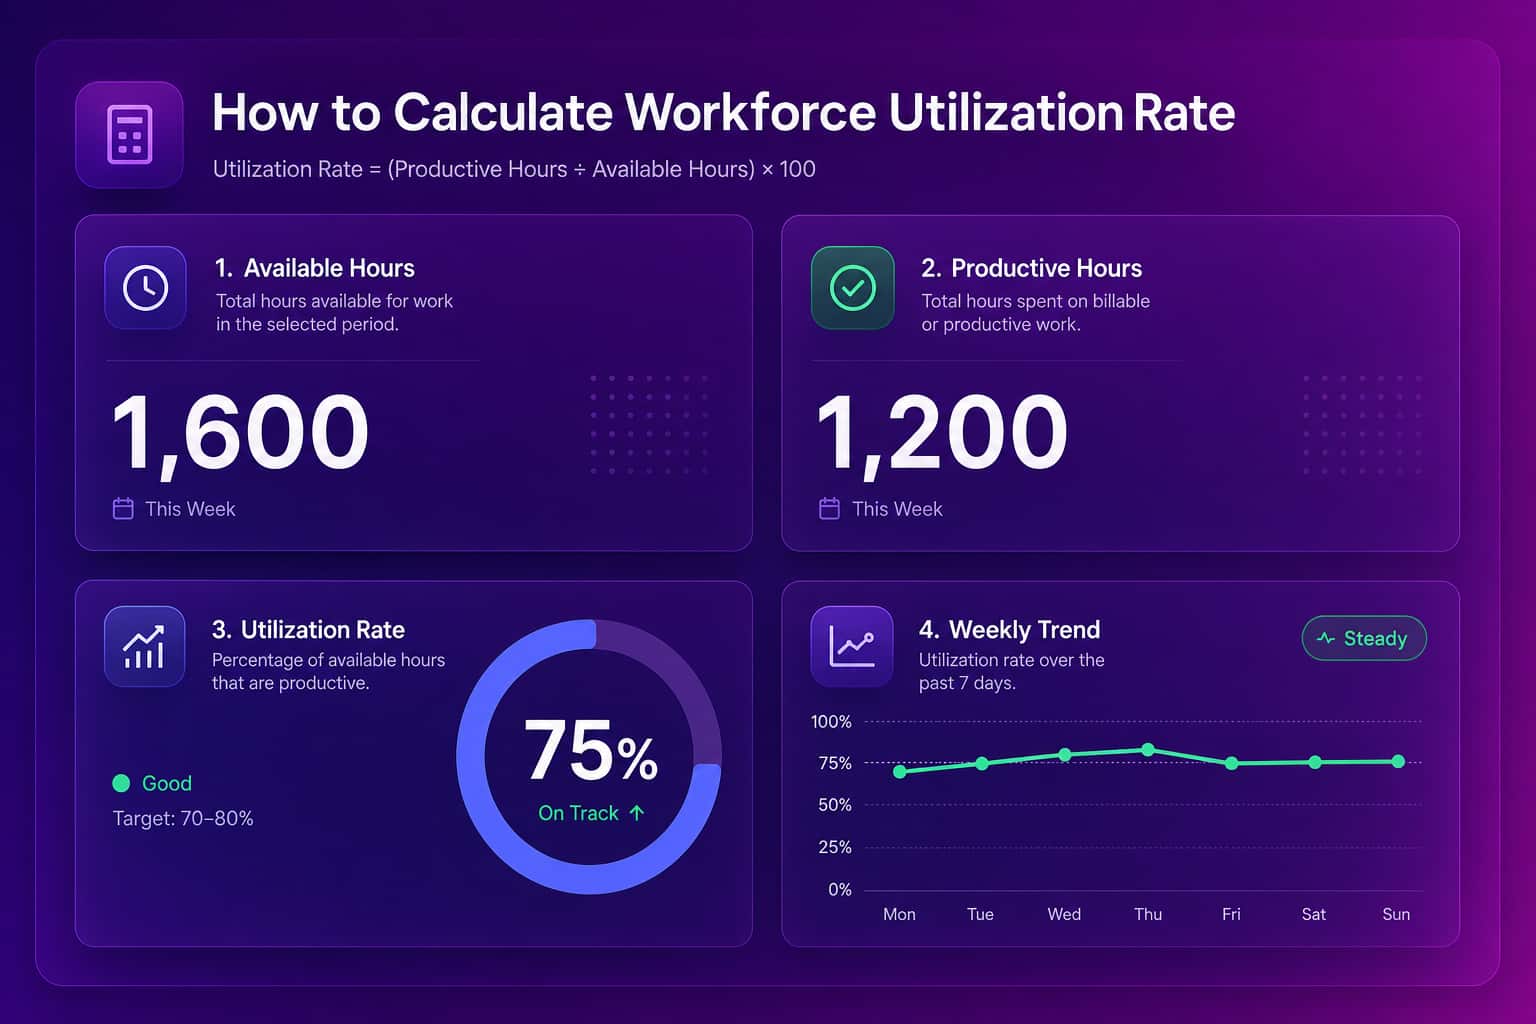
Workforce utilization rate is the percentage of a team's available working hours that get spent on productive or billable work, and it is one of the oldest capacity metrics in professional services. You calculate it by dividing productive hours by total available hours and multiplying by 100, so a team with 1,200 productive hours against 1,600 available hours runs at 75% utilization. In a consulting firm the productive hours are the ones a client pays for. In a product company they are the hours spent building, reviewing, and shipping rather than sitting in status meetings or waiting on a blocked task. The metric matters because it puts a number on something most leaders only feel: whether the people you are paying for can actually do the work you hired them to do, or whether capacity is leaking somewhere you cannot see.
The reason utilization keeps showing up on operating dashboards is that payroll is the largest line item at most tech companies, and utilization is the closest thing to a return-on-payroll number. When it drops, you are paying for capacity that never reaches a customer. When it spikes and stays there, you are usually borrowing against people's sustainability. Both cost money. For a tech company the size of our customers, unseen capacity gaps run $500K to $2M a year, which is exactly the kind of figure that gets a COO's attention in a board meeting.
How to calculate utilization rate
Calculating utilization rate takes one formula and a lot of honesty about the inputs. The formula is productive hours divided by available hours, times 100. Available hours are the total hours a person or team could work in a period. Productive hours are the ones spent on work that creates value: billable client work in services, or delivery work like building, reviewing, and shipping in a product company. The arithmetic is trivial. The hard part is the inputs, because the moment you ask people to self-report hours, the number drifts toward whatever they think you want to see. A developer logs eight hours whether they shipped a feature or fought a flaky test suite. A utilization rate built on timesheets tells you more about reporting habits than about real capacity, which is why the input problem, not the math, is what you actually have to solve.
Here is the formula broken into its parts:
- Available hours: the hours a person or team could realistically work in the period, after PTO and holidays. Ten engineers over a 40-hour week is 400 available hours.
- Productive hours: the hours spent on value work. Subtract meetings, on-call, interviews, recruiting, and admin. Ten engineers often net six people worth of delivery time.
- Utilization rate: productive hours divided by available hours, times 100. If 240 of those 400 hours are productive, the team runs at 60%.
The worked example above is the easy version, where you trust the hours. In practice, the gap between "logged hours" and "productive hours" is where every utilization rate goes wrong. Solve the inputs and the metric becomes useful. Skip that and you are reporting fiction with two decimal places.
What is a good workforce utilization rate?
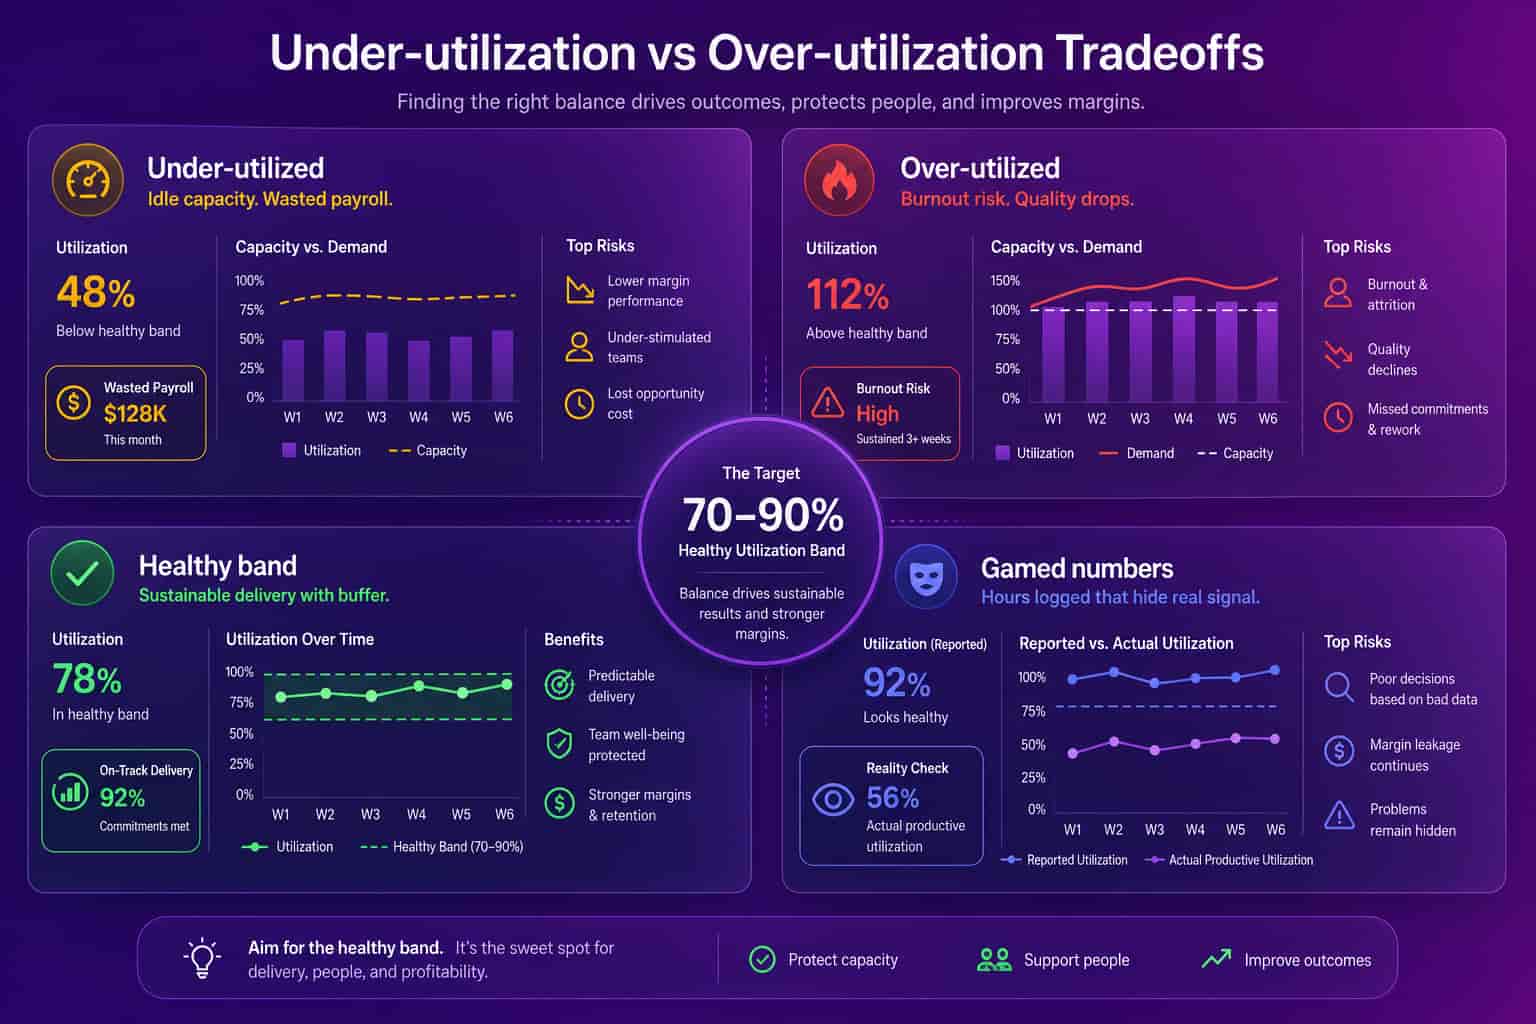
There is no single good workforce utilization rate, and any vendor who hands you one number is selling a benchmark borrowed from a business that may look nothing like yours. Billable consulting and agencies run high target bands because every productive hour maps to revenue, so idle time is pure margin loss. Product engineering is the opposite. A team pinned near 100% has no room for code review, learning, incident response, or the slack that lets people fix the thing that is slowing everyone down. The right target depends on what "productive" means for the role and how spiky the work is. The useful question is not "what is the industry standard," it is "what does a healthy utilization rate look like for this team, and what is it hiding when it drifts." That framing turns utilization from a vanity number into a capacity signal you can act on.
| Context | What "productive hours" means | What to watch |
|---|---|---|
| Billable consulting / agency | Client-billable hours | Sustained near-100% leaves no margin for rework or bench |
| Product engineering | Building, reviewing, shipping | A high rate with slow PR cycle time means a bottleneck, not productivity |
| Support / on-call | Tickets, incident response | Spiky load needs buffer, not a flat target |
Why the standard utilization rate misleads tech teams
The standard utilization rate misleads tech teams because the billable-hours model assumes every productive hour is interchangeable, and in software it is not. An hour spent shipping a feature and an hour spent stuck in a stale pull request both count as utilized time, so two teams can post identical 80% utilization rates while one ships twice as fast as the other. Utilization measures whether people are busy. It says nothing about whether the system around them lets that busy-ness turn into delivered work. This is the same trap as judging an engineer by lines of code or commits: the activity looks productive, but the outcome is invisible. For a tech company, the metric that actually predicts output is capacity-aware, which means it accounts for where the hours go (review queues, meeting load, blocked work) instead of just counting that they were spent.
This is why utilization has to sit next to flow metrics, not replace them. A rising utilization rate with a rising PR cycle time is a warning, not a win: you are adding hours to a system that already cannot ship what it has. We wrote about the delivery side of this in the engineering velocity metrics guide, and the two reads belong on the same screen.
There is a second, more expensive distortion. AI coding tools change what an "hour" produces. When a team adopts Cursor or Copilot, raw utilization can stay flat while output climbs, or seats sit idle while finance keeps renewing them. Utilization alone cannot tell you which. You need to separate human contribution from AI agent contribution to read the number honestly, which is a capability most workforce tools do not have.
How to measure utilization rate without surveillance
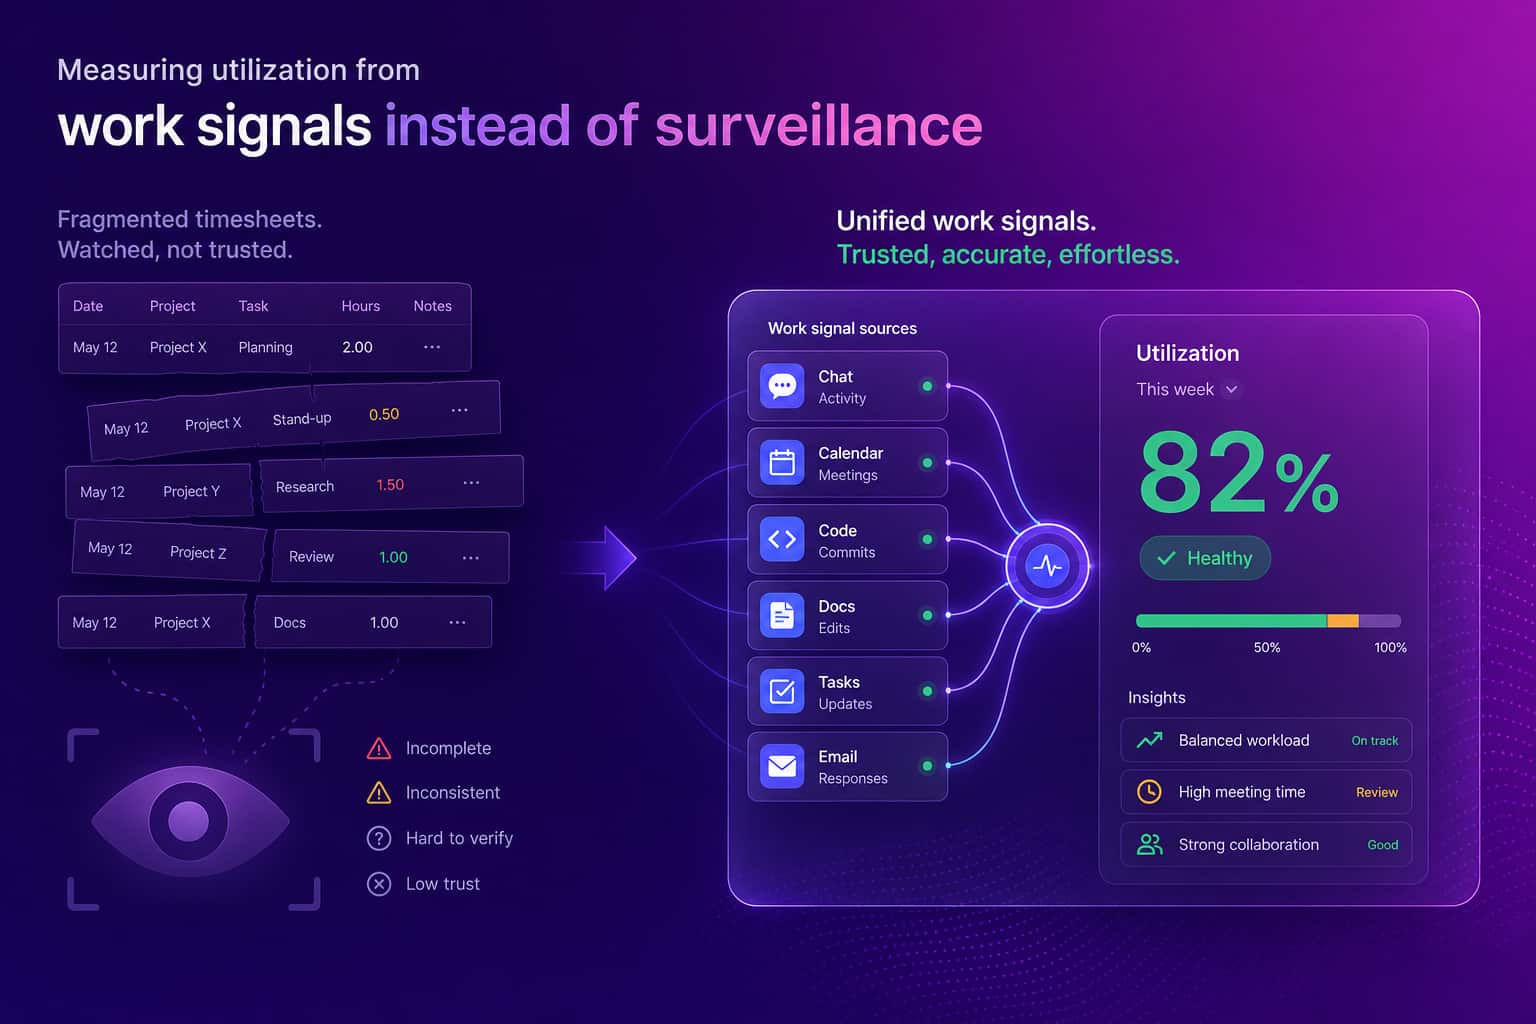
You can measure workforce utilization rate without monitoring screens, and the privacy-first version produces a better number than the surveillance one. The signals that predict real capacity already live in the tools your team uses: Jira and Linear for committed work, GitHub and GitLab for delivery, Google Workspace and M365 for meeting load and focus time. Pulling PII-free metrics from those systems by API gives you utilization, capacity, and flow without capturing email content, message content, or file content, and without a screenshot or keylogger anywhere. This matters beyond ethics. A Personnel Psychology meta-analysis found no evidence that monitoring improves performance, and 2026 survey research puts 1 in 6 workers as willing to quit over surveillance, so a utilization number bought with screen recording costs you trust to measure a signal that was never predictive. Privacy-first is the wedge we lead with at Abloomify because it survives a board meeting and an all-hands at the same time.
The architecture is two data layers. The first is 100+ API integrations across project management, code repos, communication, CRM, HRIS, and AI coding tools. The second is an optional privacy-first device agent on Mac and Windows that captures aggregated metrics like focus time and app categories, with no screenshots, no keyloggers, and no screen recording. The combination is SOC 2 Type 2 certified and GDPR compliant by design. For operations leaders the workforce analytics software page is the right entry point, and the for operations leaders solution covers how utilization fits the broader capacity picture. If you want the surveillance argument in full, the how to measure productivity without screenshots guide makes the case.
How to act on workforce utilization rate
Acting on workforce utilization rate means using it as a trigger for a question, not as a grade you assign to people. A team running low for weeks is rarely lazy. It usually means demand is mismatched, work is blocked upstream, or capacity is being eaten by meetings and unplanned support that nobody forecasted. A team running hot for weeks is the more dangerous read, because the output looks great right up until quality slips and someone resigns. The move in both cases is the same: look at where the hours are going before you change anything. Pair utilization with PR cycle time, meeting load, and AI tool engagement, and the gap between "we are busy" and "we are delivering" closes fast. That is the difference between a number on a slide and a decision you can defend.
This is also where utilization quietly steals a leader's own week. The work that fills a COO's calendar is rarely strategy. It is chasing people for status, copy-pasting metrics into decks, and digging across five tools to answer one question: who is overloaded right now? A utilization read that updates itself from connected data kills that busy-work, which is leaked capacity at the most expensive pay grade in the building. When you can see overload and slack in one view, you can rebalance before a deadline slips, catch over-utilization before it becomes attrition (the burnout detection signals surface it 60+ days early), and reclaim the idle tool seats the capacity planning workflow is supposed to find.
Utilization rate is a flashlight, not a verdict. Point it at the system, not the people. Capacity tells you the truth. Activity just tells you everyone is busy.
FAQ
What is workforce utilization rate?
Workforce utilization rate is the percentage of a team's available hours spent on productive or billable work, calculated as productive hours divided by available hours times 100. For tech companies it signals where capacity is wasted or stretched, and Abloomify tracks it across 100+ connected tools without surveillance.
How do you calculate utilization rate?
Divide productive (or billable) hours by total available hours, then multiply by 100. A developer with 32 productive hours out of 40 available runs at 80%. The hard part is not the formula, it is getting honest hours without resorting to timesheets or screenshots.
What is a good workforce utilization rate?
There is no universal number. Billable consulting chases a high band, but product engineering needs slack for code review, learning, and on-call. Push sustained utilization toward 100% and you usually buy short-term output against burnout risk, which Abloomify can flag 60+ days early.
Why does utilization rate mislead tech teams?
Because the billable-hours model assumes every productive hour looks the same. In engineering, an hour shipping a feature and an hour stuck in a stale review both count, so a high utilization rate can hide a slow delivery system. Capacity, not activity, is the real signal.
Can you measure utilization rate without monitoring software?
Yes. Abloomify reads PII-free signals from Jira, GitHub, Google Workspace, and M365 plus optional aggregated device metrics, with no screenshots or keyloggers. A Personnel Psychology meta-analysis found no evidence that monitoring improves performance, and 1 in 6 workers would quit over surveillance.
Amir Tavafi
Co-Founder & CEO
Product leader and innovator with over 15 years of experience in the tech sector, grounded in AI and robotics. Previously led product development in fraud detection and AI solutions at Nasdaq Verafin.