Operational Efficiency for Tech Companies: A 2026 Playbook
May 12, 2026
Amir Tavafi
13 min read

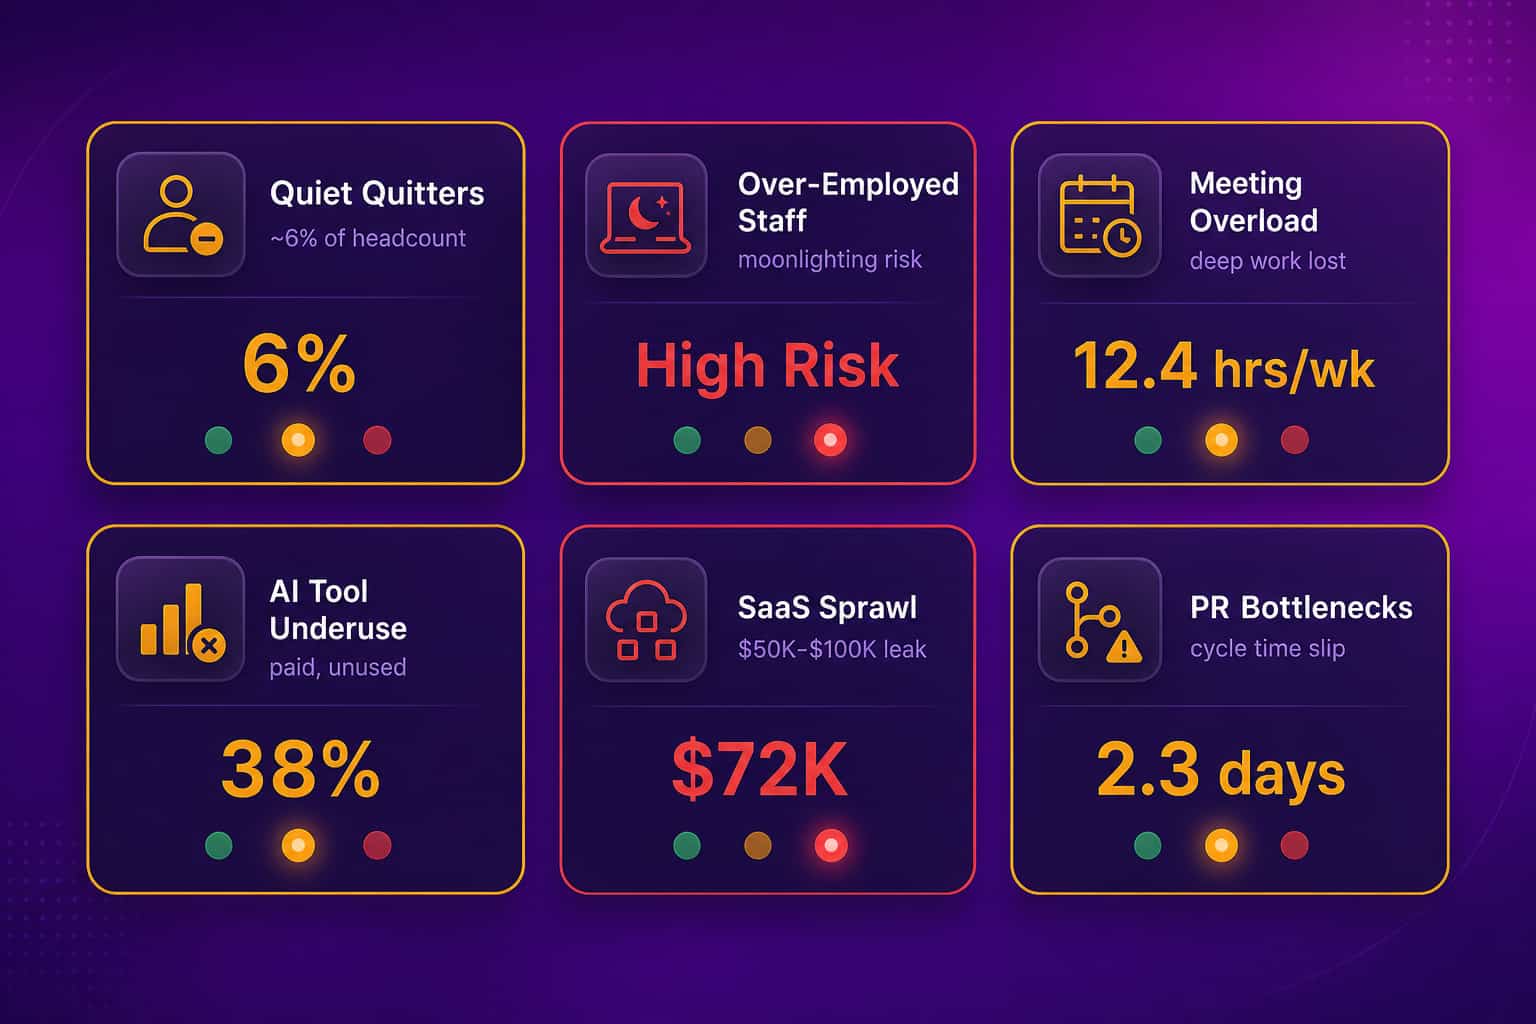
Operational efficiency in a 2026 tech company is not a cost-cutting exercise. It is a visibility problem. Most 100 to 500-person SaaS companies carry $500K to $2M in invisible workforce waste, quiet quitters, over-employed staff, capacity gaps, AI tool budget that nobody can prove is working. The number is sitting on payroll right now. Abloomify reads PII-free signals from 100+ work systems and surfaces it in 30 days, without screenshots or keyloggers.
Key Takeaways
Q: What does operational efficiency mean for a tech company in 2026?
A: It means revenue per employee, delivery velocity, capacity utilization, and AI tool ROI moving in the right direction at the same time. A 400-person fintech customer of ours rolled Abloomify across COO, CTO, VP IT, and HR for one reason. They wanted one operating picture, not four conflicting reports.
Q: Why do most operational efficiency programs fail?
A: They measure activity. Screen time, badge swipes, keystrokes. There is no evidence (Personnel Psychology meta-analysis) that activity monitoring improves performance. Worse, 1 in 6 workers say they would quit over surveillance. The output number gets worse and the trust number gets worse. You pay twice.
Q: How do you find waste without monitoring employees?
A: Through API connections to the tools where real work happens, GitHub, Jira, Google Workspace, Microsoft 365, Cursor, Claude Code, Salesforce, HubSpot. No content read, just signal. You compare what teams produce against capacity, meeting load, tool adoption, and license spend. Multi-source triangulation beats single-source screen monitoring every time.
Q: What is the fastest path to a measurable operational efficiency gain?
A: A 30-day workforce waste assessment on one Workspace or M365 tenant plus one additional source. The deliverable is a dollar-quantified report: where capacity leaks, which licenses go unused, which teams are over or under-utilized, where AI tool spend is sitting idle. You decide what to act on. If nothing actionable shows up, no further obligation.
What operational efficiency actually means in a 100-500 person tech company
Operational efficiency in a tech company is the ratio of useful output to the dollars and hours you spend producing it. The useful output is delivered features, closed deals, happy customers, working revenue. The cost side is payroll plus tools plus meetings plus everything in between. In a 100-500 person SaaS or fintech, four numbers move together: revenue per employee, engineering delivery velocity, capacity utilization across teams, and the ROI of AI and SaaS tool spend. None of them tell the whole story alone. Stacked, they tell you whether the company is compounding or quietly leaking. Most leaders look at one, miss the others, and find out at board prep that the operating picture is worse than the deck shows.
The hard part is not the definition. The hard part is that the data lives in 12 systems nobody has time to reconcile. GitHub knows PR cycle time. Jira knows scope. Workspace knows meeting load. HRIS knows headcount and tenure. Cursor and Copilot know tool usage. Your SaaS billing console knows spend. Your CFO knows revenue. Nobody connects them. You end up with a CTO who thinks engineering is humming and a COO who thinks delivery is slipping. Both can be right depending on which dashboard they open.
That is the wedge Abloomify exists to fix. We are a privacy-first workforce intelligence platform that connects to 100+ work systems via API and surfaces the operating picture in one place. PII-free by architecture, no email content, no message content, no screenshots, no keyloggers. SOC 2 Type 2 certified. The point is not "more data." The point is fewer surprises at board prep.
Why most operational efficiency programs miss the real money
Most operational efficiency programs are pointed at the wrong target. They optimize a process that was already cheap and ignore the line items that are quietly bleeding. They install ActivTrak or Insightful, watch screen activity, and conclude "engineers spent 4.2 hours in Slack last week, terrible." Meanwhile the real waste is sitting one floor up: a team of 12 engineers shipping at 60% the velocity of the team next door because PRs sit in review for three days, or 18% of the company's paid AI tool licenses are completely unused, or 22 meetings per week per IC are eating the engineering hours the CFO already paid for. Surveillance does not surface any of that. There is no evidence that monitoring improves performance (Personnel Psychology meta-analysis), and 1 in 6 workers say they would quit over it. You pay for the tool, lose the trust, and miss the waste.
The pattern repeats across categories. Spreadsheet capacity planning gives you stale numbers a quarter late. BI dashboards show what happened, not who is under-utilized or which AI tool license is shelfware. Survey-based engagement tools tell you how people feel but not whether work is leaking. None of these are bad. They just are not pointed at operational efficiency. They are pointed at activity, sentiment, or history.
What actually moves the number is multi-source signal. PR cycle time correlated with team size and on-call load. Capacity utilization correlated with meeting hours and deep work time. AI tool usage correlated with code output and review velocity. License usage correlated with seats paid. None of those need to read a single email, screenshot a single window, or capture a single keystroke. They need API access and a layer that joins them, which is the job we built Abloomify to do.
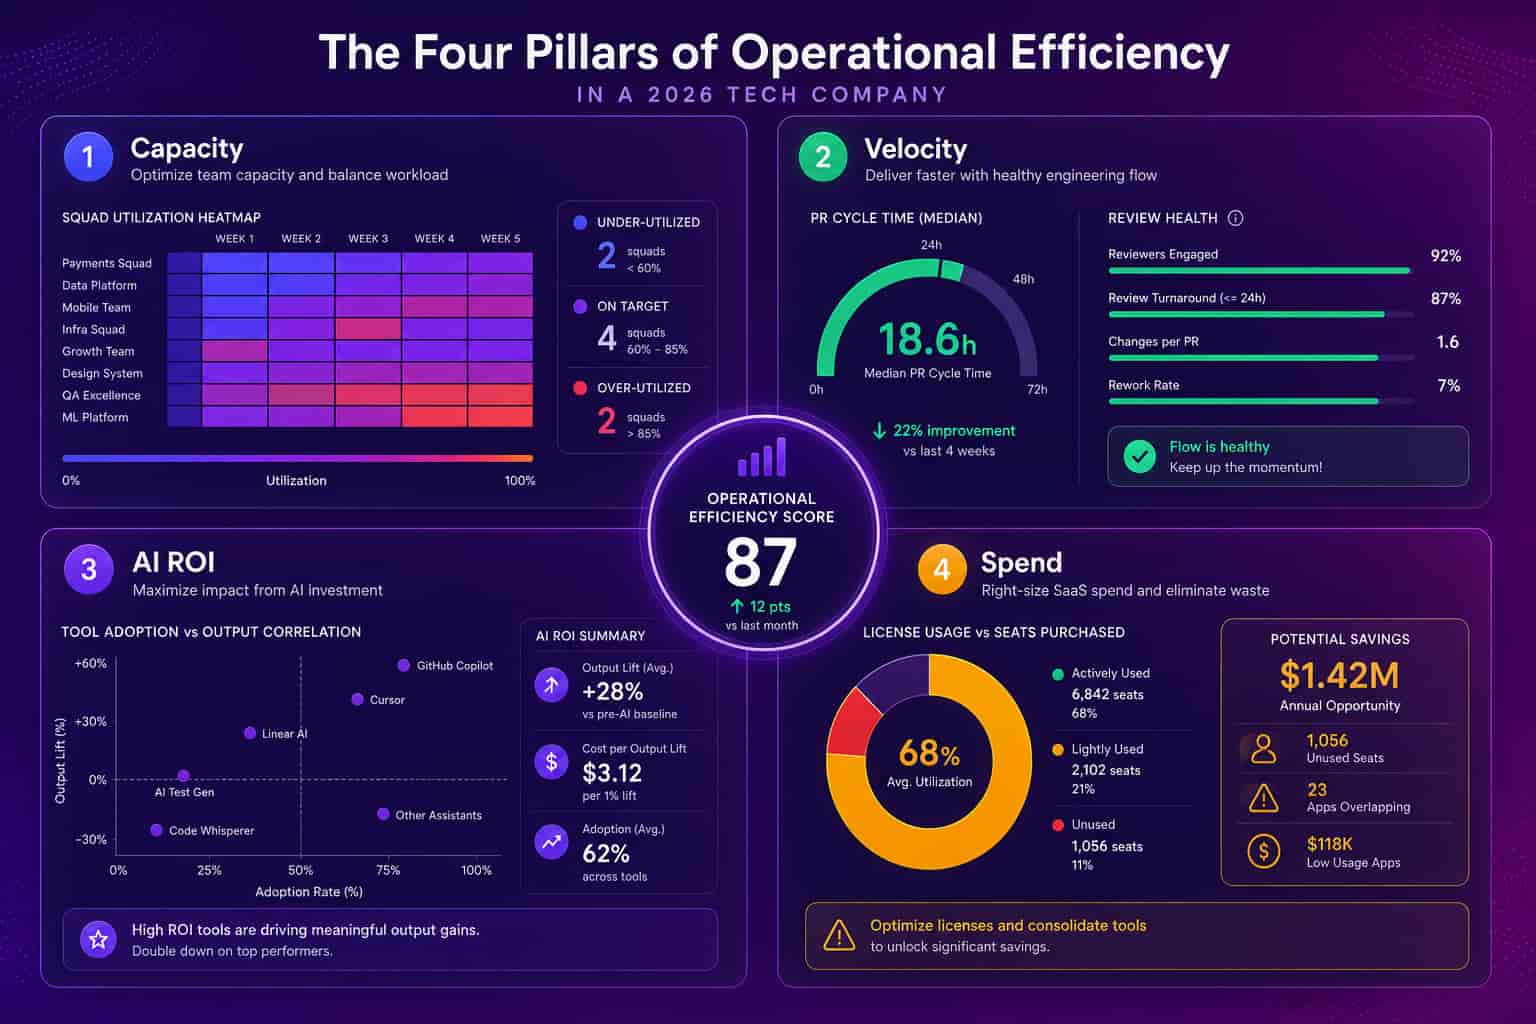
The four signals that actually predict operational efficiency
Four signals do most of the heavy lifting on operational efficiency in a 100 to 500-person tech company. The first is capacity, who is under-utilized, who is over-utilized, where deep work time evaporated into meetings. The second is engineering velocity, PR cycle time, review health, sprint completion, the human vs AI agent contribution split that nobody else tracks. The third is AI tool ROI, are Cursor, GitHub Copilot, and Claude Code actually translating to faster delivery, or are they expensive license noise. The fourth is spend, SaaS license usage versus seats purchased, tool overlap, the shadow IT layer that finance does not know exists. Stack the four together and the picture stops being abstract. You can put a dollar number on every gap and prioritize what to fix this quarter versus next.
Each signal needs more than one data source to be honest. Capacity from a calendar alone is misleading because meeting-stuffed weeks can hide either real coordination or pure overhead. Capacity from work-system signals plus calendar plus optional privacy-first device agent metrics gives you a real read. Velocity from Jira alone tells you tasks moved, not delivery quality, so you add GitHub for code-side reality. AI tool ROI from a usage dashboard tells you logins, not output, so you correlate against PRs and review timing. Spend from a finance spreadsheet shows the bill, not who is actually using which license, so you cross-check against actual platform telemetry.
How to measure operational efficiency without surveillance
You measure operational efficiency without surveillance by reading signals from the systems where work already happens, not from a camera pointed at the employee. Abloomify connects to GitHub, Jira, Linear, Bitbucket, Google Workspace, Microsoft 365, Slack, Teams, Cursor, Claude Code, GitHub Copilot, Salesforce, HubSpot, Gong, Workday, BambooHR, ADP, Rippling, and 80+ others via API. No email content, no message content, no file content. Optional privacy-first device agents for macOS and Windows collect aggregated usage metrics only, no screenshots, no keyloggers, no screen recording. You get the visibility ActivTrak buyers want, plus the cross-tool intelligence they cannot get, without the employee trust damage. The architectural difference matters because it changes what employees do when you ship it. Surveillance tools generate avoidance behavior, jiggled mice, faked activity, slow attrition. API-connected workforce intelligence generates indifference, which is the right reaction, because nothing has changed about how people do their job.
The mechanics are straightforward. Connect Google Workspace or Microsoft 365 first because that is where the most diagnostic value sits at the lowest setup cost. Add one delivery source (GitHub or Jira). Add HRIS for headcount and cost data (Workday, BambooHR, Rippling, ADP, etc.). The platform builds a baseline in 7 to 14 days. Anomalies surface as alerts (a team's PR cycle doubled, a license utilization dropped below 30%, deep work hours collapsed on a specific squad). You triage. You act. Most customers see actionable findings before the 30-day mark, which is why the standard offer is bounded that way.
For the engineering side specifically, the human vs AI agent contribution split is the signal most operational efficiency programs miss entirely. AI coding tools are now responsible for a measurable share of code generated, code reviewed, and tickets closed. If you cannot separate human and AI contribution, you cannot answer the board question "is our AI tool spend working." Most companies cannot answer it. That alone is worth running the diagnostic for.
A 30-day operational efficiency assessment that actually moves the number
A 30-day operational efficiency assessment is the fastest honest path from "we think we have waste" to "here is the dollar number and here is the action list." The Abloomify version connects one Workspace or M365 tenant plus one additional source (GitHub, Jira, or HRIS) and delivers an executive report at the end of 30 days with three things: a dollar-quantified waste map, a capacity utilization heatmap by team and function, and a prioritized list of actions sorted by expected impact. Setup is one hour of read-only access from an admin. There is no agent install required in the diagnostic phase. If nothing actionable surfaces, no further obligation. That last line matters because most workforce analytics tools sell six-month implementations before they prove anything. We sell the proof first.
The reason 30 days is enough is that the meaningful patterns in a 100 to 500-person tech company show up fast once you join the data. PR cycle time, meeting load, license utilization, and capacity gaps stabilize inside two sprints. The patterns that take longer (true retention risk, full AI tool ROI curves, cross-tool collaboration health) are the second-phase signals, and you do not need them to start. You need the obvious dollars on the table so the CFO can sign off on phase two.
Three caveats worth saying out loud. First, single-source data under-proves value. We learned this the hard way with a 3,500-person enterprise customer where Google Workspace alone showed low correlation to their internal performance metrics. Connect two sources, not one. Second, capacity waste does not always mean layoffs. Most of the dollars come from reallocation, license consolidation, meeting hygiene, and AI tool concentration. The board likes that conversation more than the layoff one. Third, do not run this if you are not willing to act. Visibility without action just generates anxiety.
How to evaluate an operational efficiency platform before you sign
Evaluating an operational efficiency platform is mostly a privacy and proof exercise. Ask three questions. First, what does the platform read from employee devices, screenshots, keystrokes, screen recording, file content, or aggregated metrics only? If the answer involves screenshots or keyloggers, you are buying a surveillance tool with a marketing rebrand, and 1 in 6 employees will tell you they would quit over it. Second, how many data sources does the platform actually correlate, single source like Workspace, dual source like Workspace plus GitHub, or true multi-source across delivery, capacity, tools, and spend? Single source under-proves value (we learned this in a 3,500-person deployment). Third, how fast does the platform produce a dollar-quantified report, 6 months, 90 days, or 30 days? If the vendor cannot show you a number in 30 days, they are selling implementation, not insight.
A short comparison is useful here. ActivTrak, Insightful, Time Doctor, and Hubstaff are endpoint monitoring tools. They install agents that watch screens, optionally take screenshots, and produce activity scores. They have mature surveillance features and a decade of compliance familiarity. They do not have engineering metrics, AI tool ROI, or cross-tool correlation. Visier, ChartHop, and Worklytics sit closer to people analytics or collaboration analytics. Strong at HR demographics, headcount, or M365 collaboration, weaker at engineering delivery, AI tool ROI, or operational efficiency as a whole. Jellyfish and LinearB are pure engineering analytics, deep on the eng side, silent on the other 80% of the company.
Abloomify is the platform built specifically for operational efficiency across the whole tech company, privacy-first by architecture, multi-source by design. We are smaller than the legacy vendors, which is a tradeoff. We ship in days, not quarters. You get the founders' direct number. Big companies bring ceremony. Startups bring outcomes.
FAQ
What is operational efficiency in a tech company?
Operational efficiency is the ratio of useful output to the dollars and hours you spend producing it. In a 100-500 person SaaS or fintech, that means revenue per employee, engineering delivery velocity, capacity utilization across teams, and the ROI of AI and SaaS spend. The number gets worse silently. Most leaders find out at board prep or layoff time, not before. Multi-source signal beats single-source dashboards every time.
How do you measure operational efficiency without monitoring employees?
You connect API integrations to the systems where work already happens (GitHub, Jira, Google Workspace, Microsoft 365, Cursor, Claude Code, Salesforce, Workday, etc.) and read PII-free signals only. No email content, no message content, no screenshots, no keyloggers. Optional privacy-first device agents collect aggregated metrics, not screen content. Abloomify is built this way from the ground up, SOC 2 Type 2 certified, with private cloud and BYOC deployment for regulated industries.
What are realistic operational efficiency metrics for 2026?
Four metrics carry most of the weight: revenue per employee (top quartile is around $250K+ for SaaS), PR cycle time (target 24 hours or less), unused SaaS license rate (below 10%), and meeting hours per IC per week (below 8). Look at all four at once, not one in isolation. Pair each with a capacity heatmap so you see which team or function is creating or dragging the number.
How much waste does a typical 100-500 person tech company carry?
The pattern we see is $500K to $2M per year in capacity-related waste, plus $50K to $100K per year in unused SaaS licenses, plus an AI tool spend line that is growing fast and largely unmeasured. A 3,500-person enterprise customer reclaimed roughly $1.8M in payroll plus $54K in SaaS inside a 30-day diagnostic. Numbers scale roughly with headcount, but waste rate stays surprisingly consistent across sizes.
How is Abloomify different from ActivTrak or Time Doctor?
ActivTrak and Time Doctor are endpoint monitoring tools that capture screen activity, optionally with screenshots, keystrokes, or screen recording. They generate employee resistance and have no evidence of improving performance (Personnel Psychology meta-analysis). Abloomify is privacy-first workforce intelligence. We connect to 100+ tools via API, read PII-free signals only, and surface operational efficiency across capacity, engineering velocity, AI tool ROI, and spend. Same visibility goal, fundamentally different architecture.
Amir Tavafi
Co-Founder & CEO
Product leader and innovator with over 15 years of experience in the tech sector, grounded in AI and robotics. Previously led product development in fraud detection and AI solutions at Nasdaq Verafin.