Best Performance Management Tools for Agencies (2026)
April 19, 2026
Walter Write
4 min read

Agency leaders need performance tools that connect delivery outcomes to coaching. Abloomify's AI Chief of Staff, Bloomy, gives managers instant performance insights from live data across 100+ connected tools.
Key Takeaways
Q: What should agencies measure?
A: Asset throughput and cycle, review/QA quality, client results (engagement/CPA), and sustainable utilization, tied together on demand via Bloomy.
Q: Which tools help?
A: Workforce analytics for outcome links, project/asset platforms, QA/review systems, and client analytics.
Q: Targets?
A: Throughput +20–30% with review quality steady, revision loops down, and engagement/CPA improving on focus campaigns.
Which signals matter most, and what quick reference should we use?
- Throughput & cycle: assets shipped, loops, time
- Quality: on‑brief score, error rate
- Results: engagement lift, CPA/CPL
- Utilization: role mix, schedule variance
| Metric category | Example metrics | Why it matters |
|---|---|---|
| Throughput & cycle | Assets shipped, cycle time, loops | More value shipped faster |
| Quality | On‑brief score, error rate | Fewer revisions protect margin |
| Results | Engagement, CPA/CPL | Connects work to outcomes |
How do tools compare at a glance?
We compare workforce analytics, project/asset platforms, QA/review, and client analytics by how well they connect asset velocity and quality to campaign results.
| Capability | Workforce Analytics | Project/Asset | QA/Review | Client Analytics |
|---|---|---|---|---|
| Outcome correlation | Throughput/quality → CPA/engagement | Tasks/assets only | Review quality only | Results only |
Which data sources and integrations do we use?
- Project/asset systems for briefs, statuses, review loops
- QA/review for on‑brief scores and error categories
- Client analytics for engagement/CPA outcomes
- Time/PSA for role mix and schedule variance
What targets are reasonable?
Targets should be reachable in a quarter and visible on demand via Bloomy so creative leads can steer actions.
- Throughput +15–30% with on‑brief score ≥ 90
- Loops per asset −20–35%; cycle time −10–25%
- CPA down and engagement up on focus campaigns
Which thresholds should trigger coaching?
Use thresholds so producers can intervene consistently across pods.
| Signal | Threshold example | Action |
|---|---|---|
| Loops per asset | 2 for a week | Tighten briefs; add example library |
| On‑brief score | 90 on reviewer average | Add review gates; coach reviewers |
| Cycle time | baseline by 20% | Remove bottlenecks; parallelize stages |
What did a pilot achieve?
In six weeks, the content program standardized briefs and review gates. Throughput rose 24% with steady quality, loops dropped, and two campaigns showed engagement lift and improved CPA in target segments.
Before vs after (agency snapshot)
Before
- Briefs unclear; loops frequent
- Examples scattered; QA inconsistent
- CPA fluctuates without insight
After (6 weeks)
- Brief templates enforced
- Review gates and example library live
- CPA/engagement tracked to assets
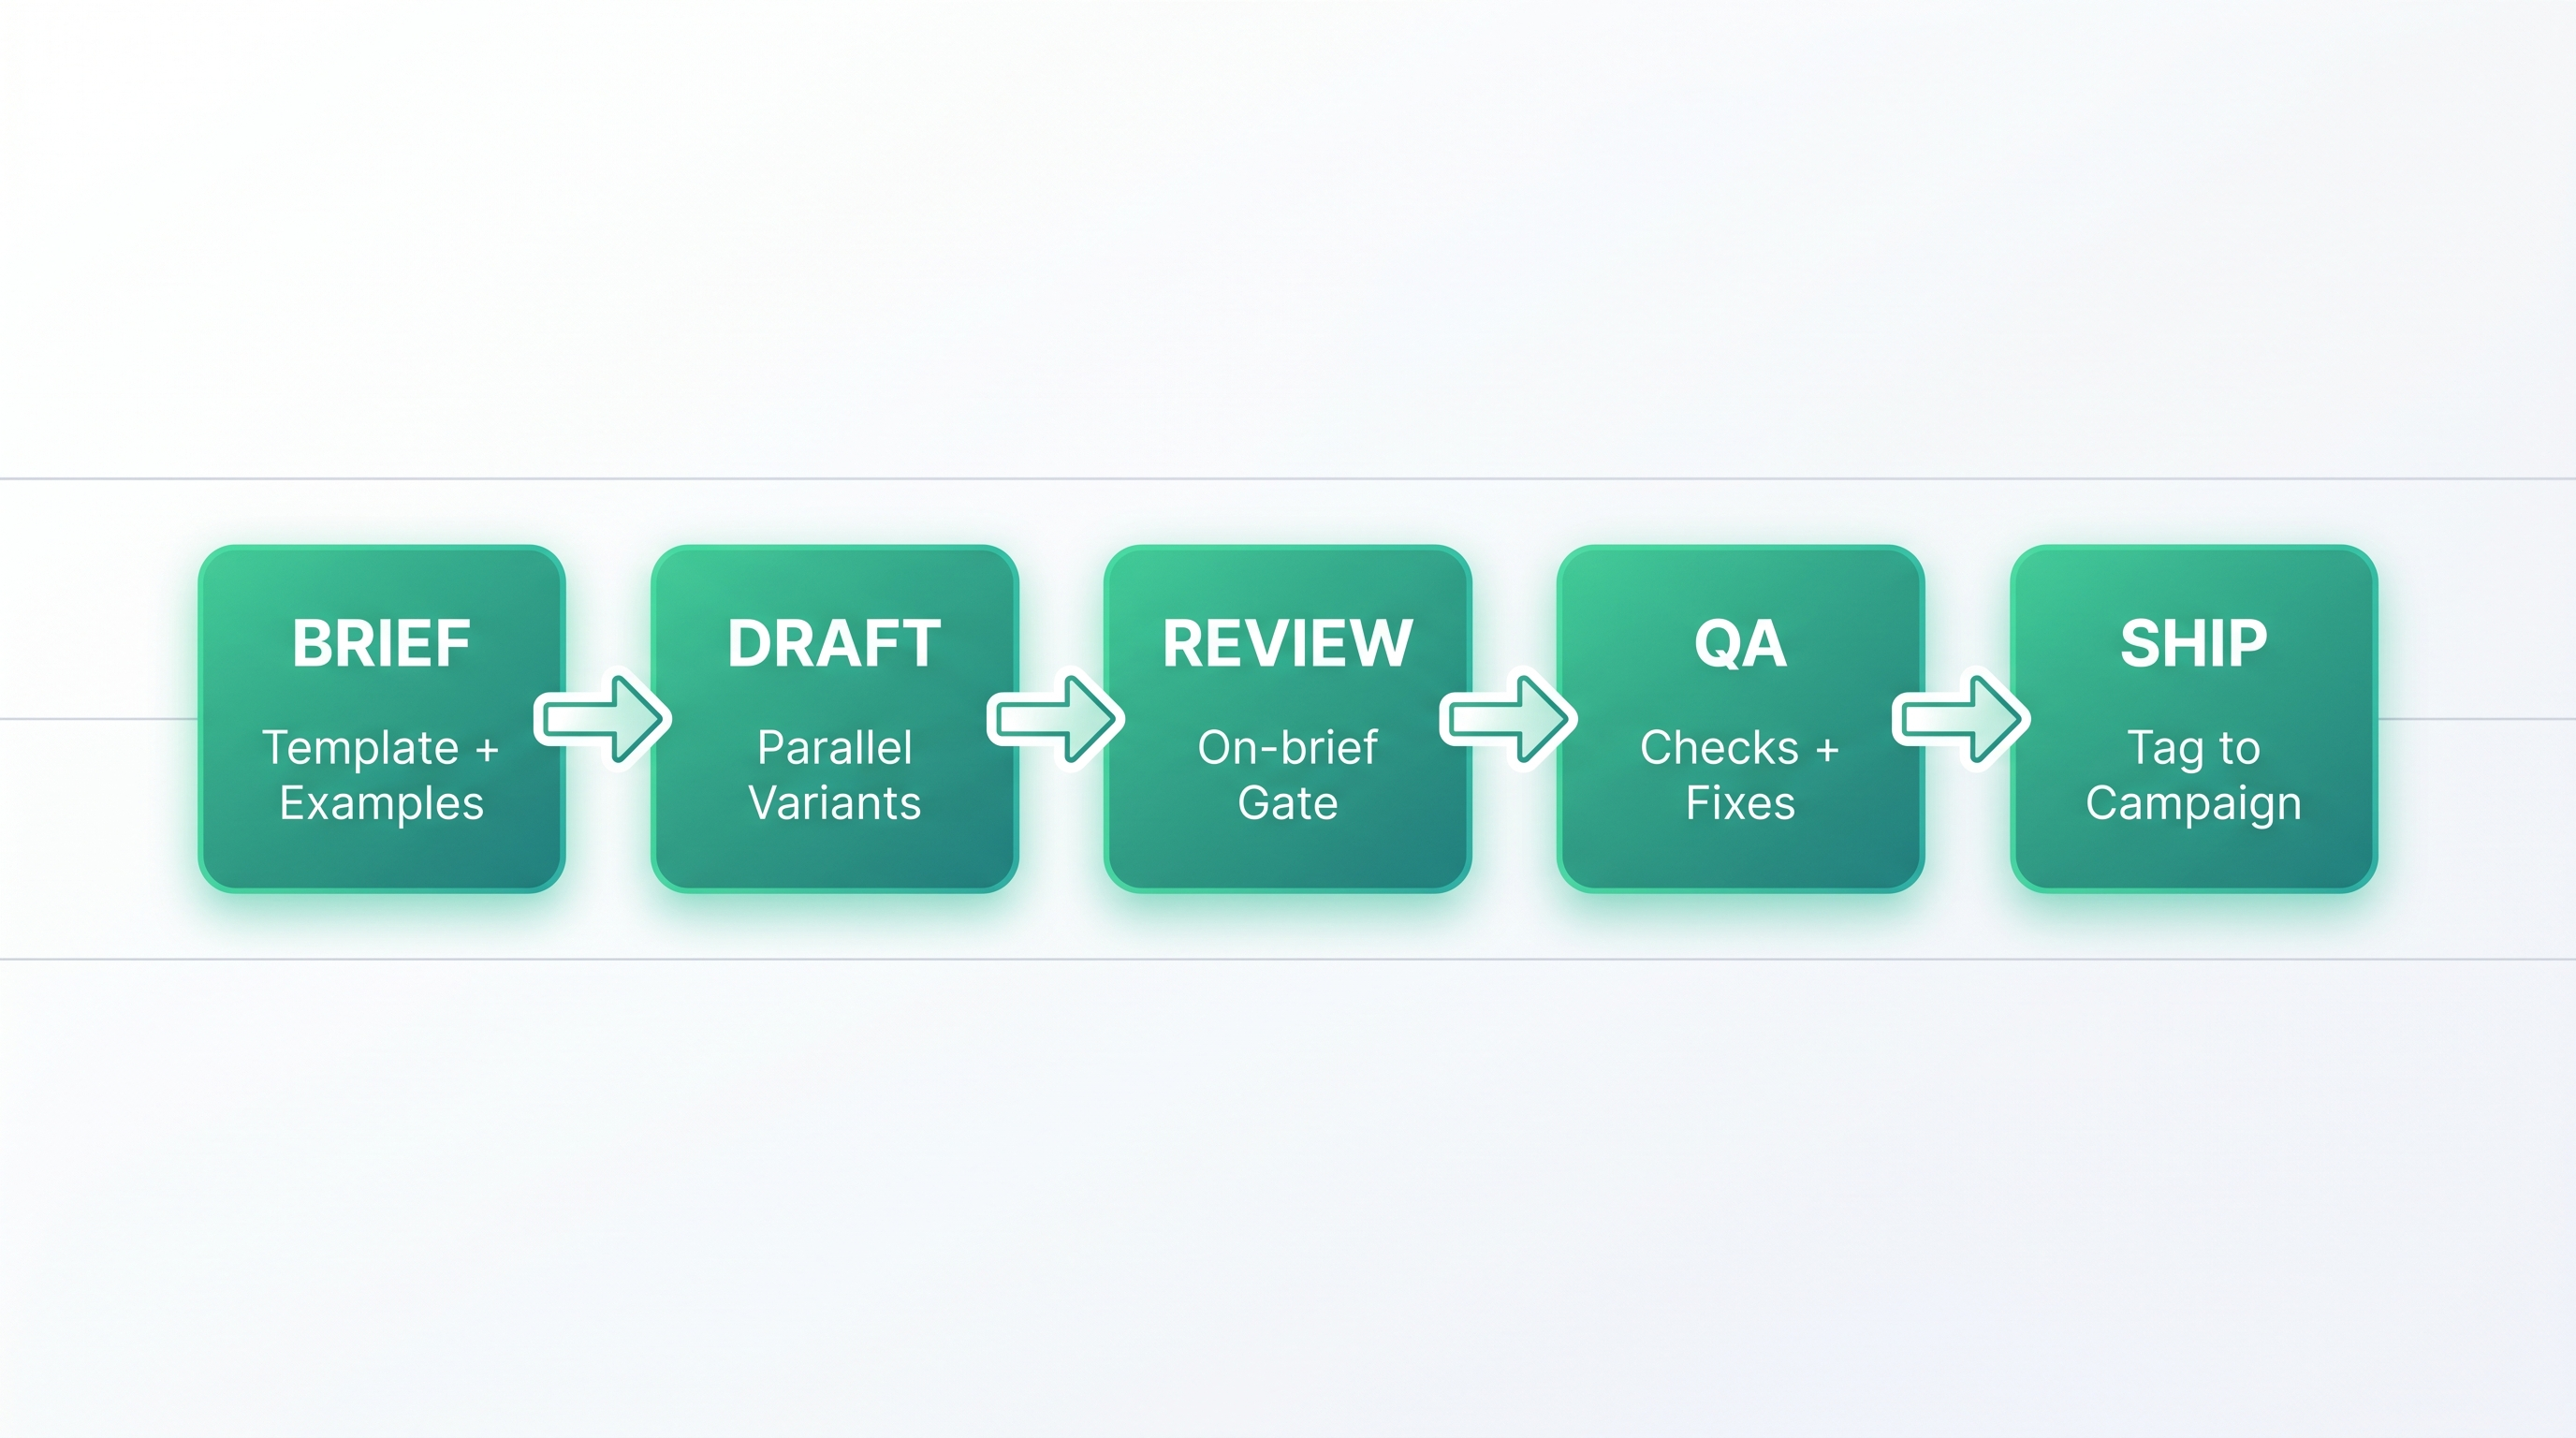
Creative pipeline swimlane (visual)
Campaign storyboard (example)
STEP 1
🎯
Concept
- Single‑minded message + audience
- Value prop and CTA aligned
STEP 2
✏️
Creative
- Examples linked to the brief
- Parallel variants to reduce loops
STEP 3
📈
Measure
- CPA and engagement targets
- Assets tagged to campaigns
What is our 8‑week rollout plan?
Week 1–2: Baseline throughput/loops and CPA/engagement.
Week 3–4: On-demand snapshot via Bloomy; stronger briefs/review gates.
Week 5–6: Examples library; targeted coaching.
Week 7–8: Review; scale to more campaigns.
Week 3–4: On-demand snapshot via Bloomy; stronger briefs/review gates.
Week 5–6: Examples library; targeted coaching.
Week 7–8: Review; scale to more campaigns.
What’s our definition‑of‑done checklist?
- □On-demand snapshot via Bloomy live
- □Briefs and review gates updated
- □Examples library curated
What leadership reporting should we use?
- On demand: ask Bloomy for throughput, loops/cycle, on‑brief score, CPA/engagement
- Monthly: utilization sustainability and campaign outcomes
What does “good” look like by area?
Throughput & cycle
- Assets moved in small batches; loops trending down
Quality
- On‑brief score high; fewer errors before ship
Results
- Engagement lift and CPA improving in target segments
Utilization
- Sustainable load; role mix balanced for speed and quality
What operating cadence keeps momentum?
- On demand: ask Bloomy for one snapshot with three actions per pod
- Monthly: template refresh and results review by client
FAQ
Q: Can we hit throughput without burning teams?
A: Yes, shorten cycles, reduce loops with better briefs, and balance utilization.
Q: How do we connect creative to results?
A: Tag assets to campaigns and review CPA/engagement alongside throughput.
What does our measurement glossary include?
- On‑brief score: reviewer rating that creative matches the brief
- Loops per asset: revision passes before ship
- Cycle time: start‑to‑ship time per asset
- CPA: cost per acquisition; paired with engagement for context
Next steps
Pick one client and three measures (throughput, loops, CPA/engagement). Use Bloomy to generate the live snapshot, coach on briefs/reviews, and scale in week eight.
Ask Bloomy any question about your team and get answers from live data, instantly.
Walter Write
Staff Writer
Tech industry analyst and content strategist specializing in AI, productivity management, and workplace innovation. Passionate about helping organizations leverage technology for better team performance.